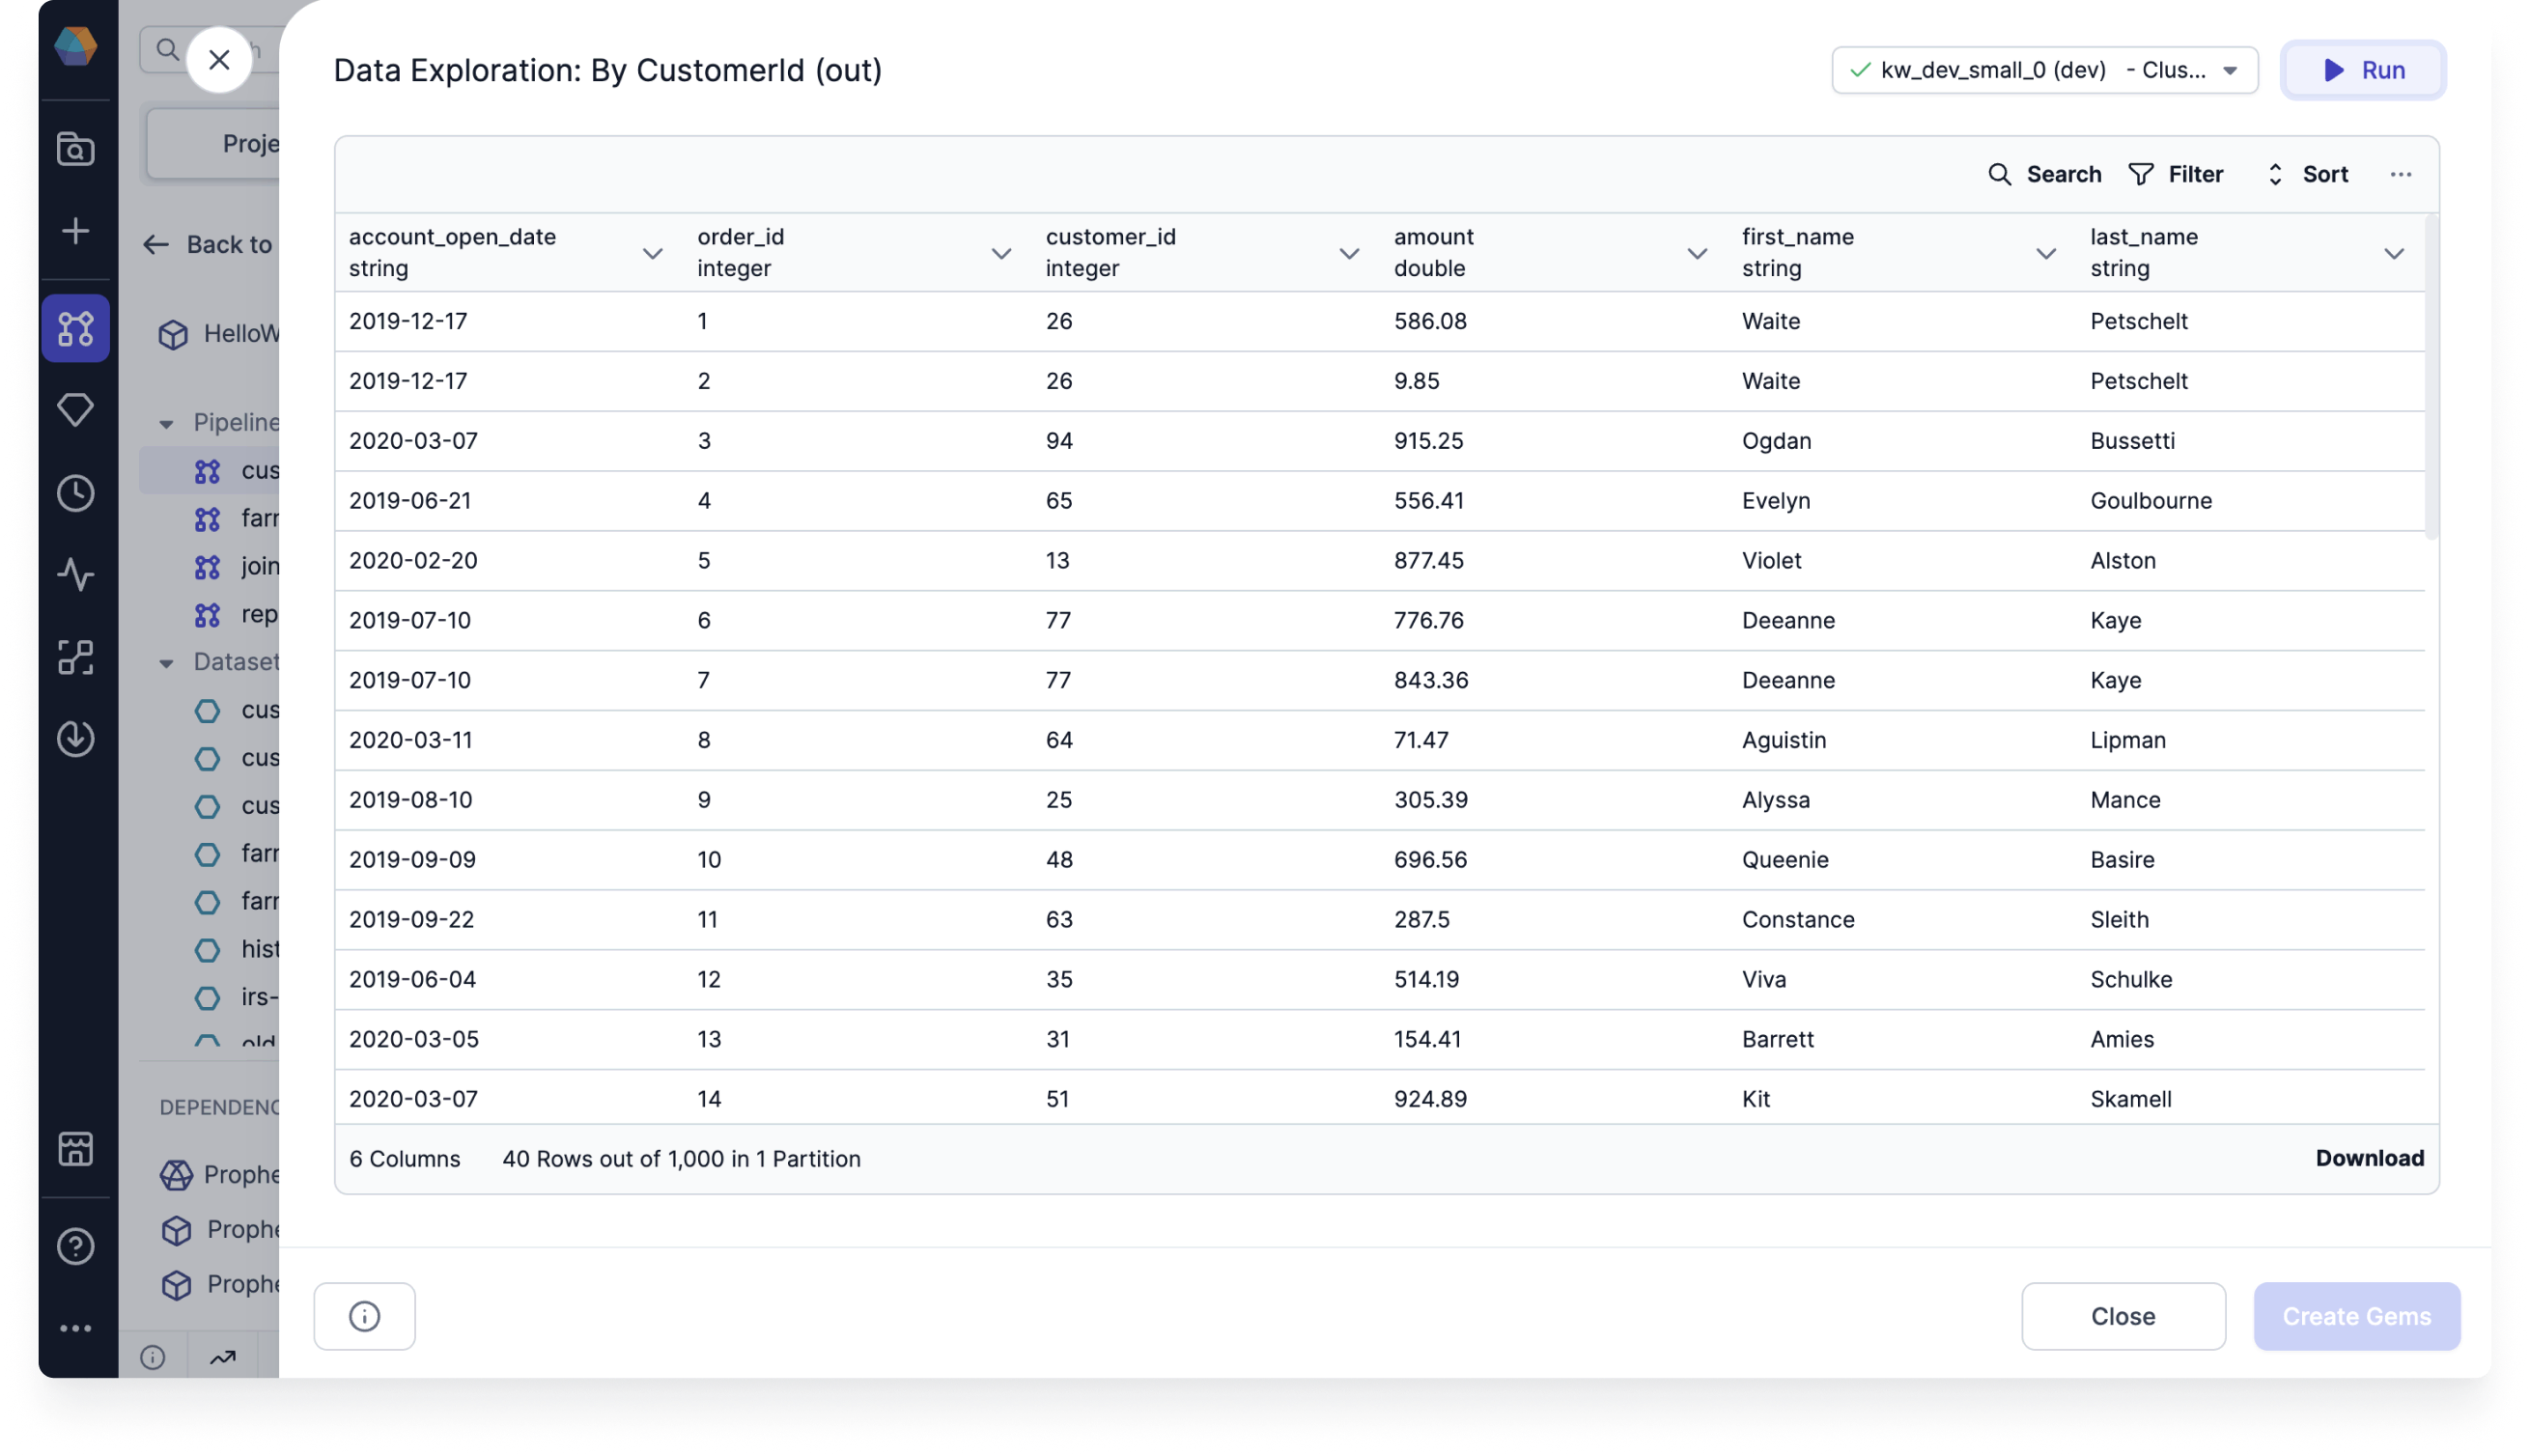
Data Explorer
The Data Explorer can help you navigate your interim data samples and understand your data better. Use it to confirm the structure of each column, review data entries, and make sure the data types are correct.
When you open the Data Explorer for an interim, you can:
- Filter the data.
- Sort the data.
- Search through the data.
- Show or hide columns.
- Load more rows into the preview sample.
- Download data in CSV or JSON format.
- Create a new gem.

Data sample
When you filter, sort, or search through the data, you are only working with the visible sample of the data. To apply these to the whole dataset in the preview, you must either:
- Load the whole dataset into the preview by clicking Load More after the last record in the preview until all records are shown.
- Click Run in the top right corner of the data preview. This will filter and sort based on all of the data in the backend (rather than a sample).
Create gems
After analyzing the data, you can retain the filter and sort options in the pipeline by clicking on the Create Gems option. This action saves the applied filter and sort as a Filter and OrderBy gem in the pipeline.
Large sample interims
If you want to see larger samples in the Data Explorer, you can enable the Selective data sampling setting. When you enable this option, you will be able to see up to 10,000 rows in the data sample by default. You'll also see all columns by default.
You can still load more records into the preview when using selective data sampling.
Disable per gem
If you disable the large data preview on an individual gem, you'll see a pale-color interim on its output after running the data pipeline. This means that no data sample was generated.
If you want to generate the data preview, open the pale interim and it will load the data. After it loads, the interim will look like a normal interim.