Data Explorer
The Data Explorer feature empowers users to seamlessly explore and analyze their data samples directly within the user interface (UI). This feature provides a range of capabilities to help users gain insights, verify data accuracy, and make informed decisions.
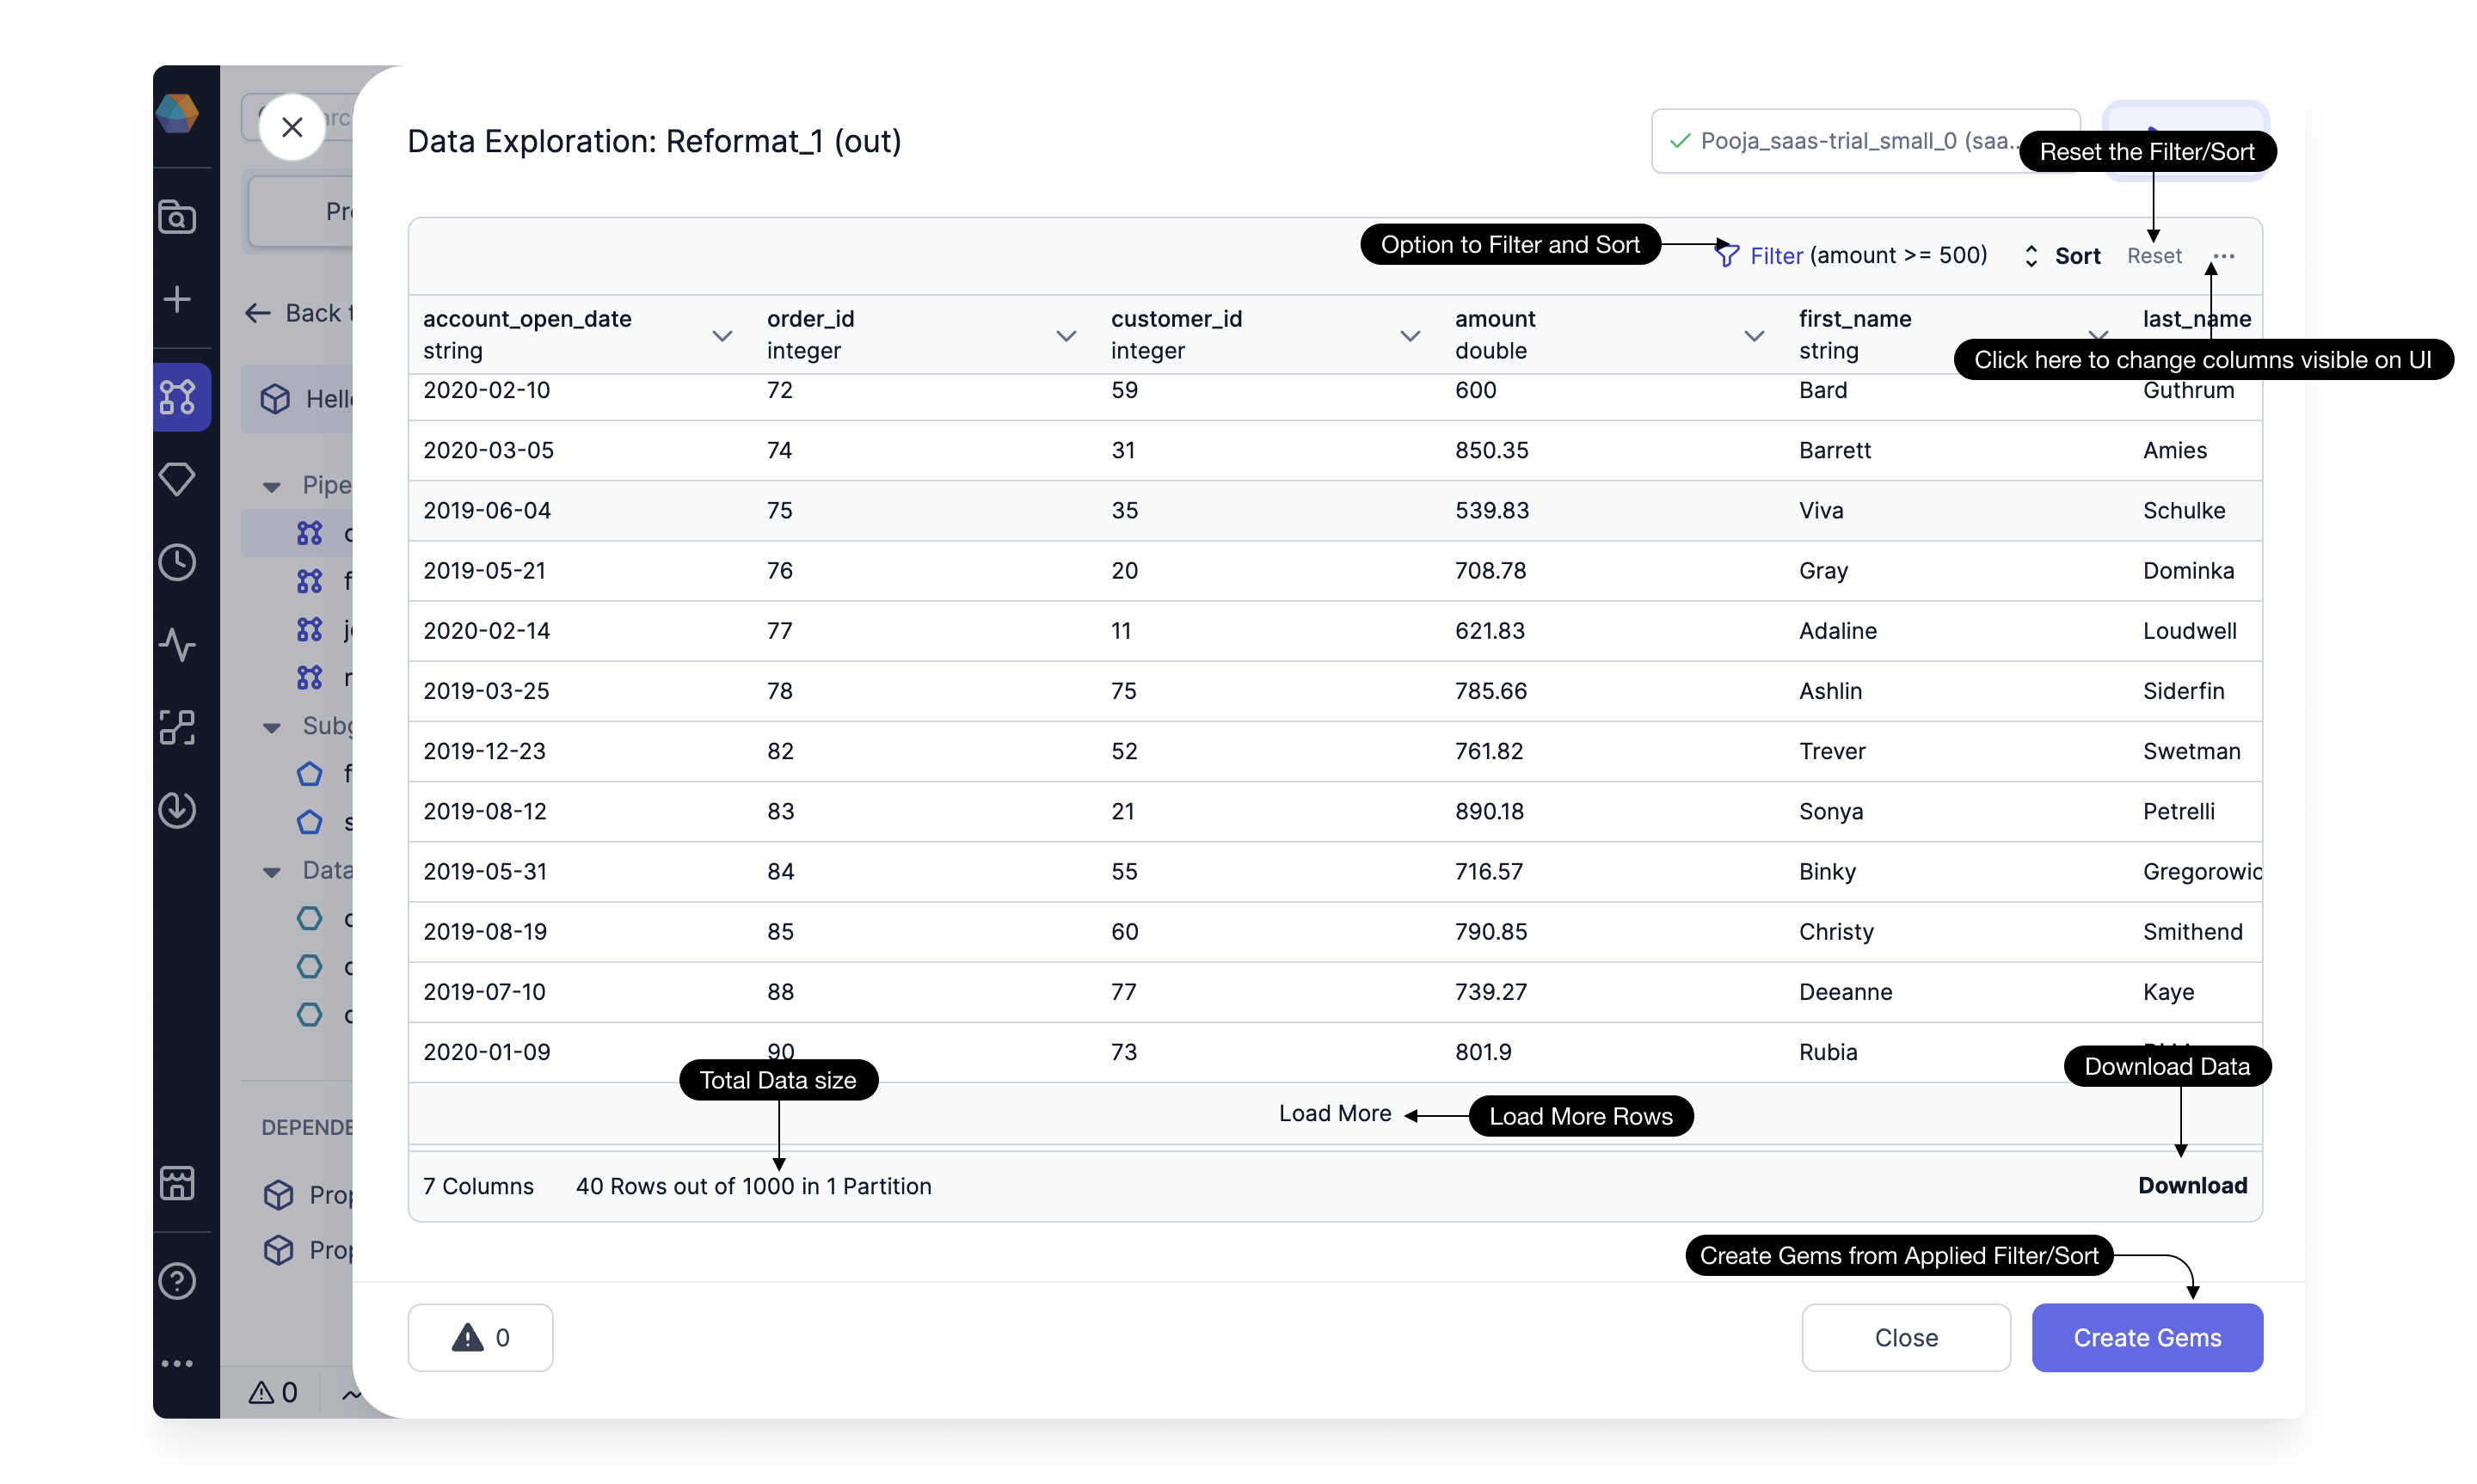
Filter and Sort Options
Users can apply filters and sort rows based on any column, enhancing visibility and improving data analysis.
Please note that after applying or modifying any filter or sort criteria, you need to click the Run button to update the displayed data.
Reset Applied Filters and Sort
Easily reset any applied filters and sorting settings by clicking on the reset button.
Column Visibility Filtering
Conveniently filter columns visible in the UI by clicking on the ellipsis ... icon. No need to rerun the process to reflect these changes in the UI.
Load More Rows and Total Count
View and assess a larger Dataset by loading more rows. The total count of rows and columns is visible, providing a comprehensive overview of the data.
Download Data
Download the visible data in the UI in CSV and JSON format using the dedicated download button.
Create Gems
After analyzing the data, users can retain the filter and sort options in the Pipeline by clicking on the Create Gems option. This action saves the applied filter and sort as a Filter and OrderBy Gem in the Pipeline.