Send Spark cluster details
Applicable to the Enterprise Edition only.
There are helpful Spark cluster configurations and a connectivity check that you can send to us via the Prophecy Support Portal for troubleshooting.
Spark configurations
Two ways to access the configurations:
- Browsing the Spark UI
- Running a notebook
Configurations in the UI
You can access your Spark cluster configurations directly from the Spark UI.
Please send screenshots of each configuration if possible.
| Configuration to Send | Example |
|---|---|
| Overall cluster configuration (e.g., Spark version, Databricks runtime version, UC dedicated or UC standard) |  |
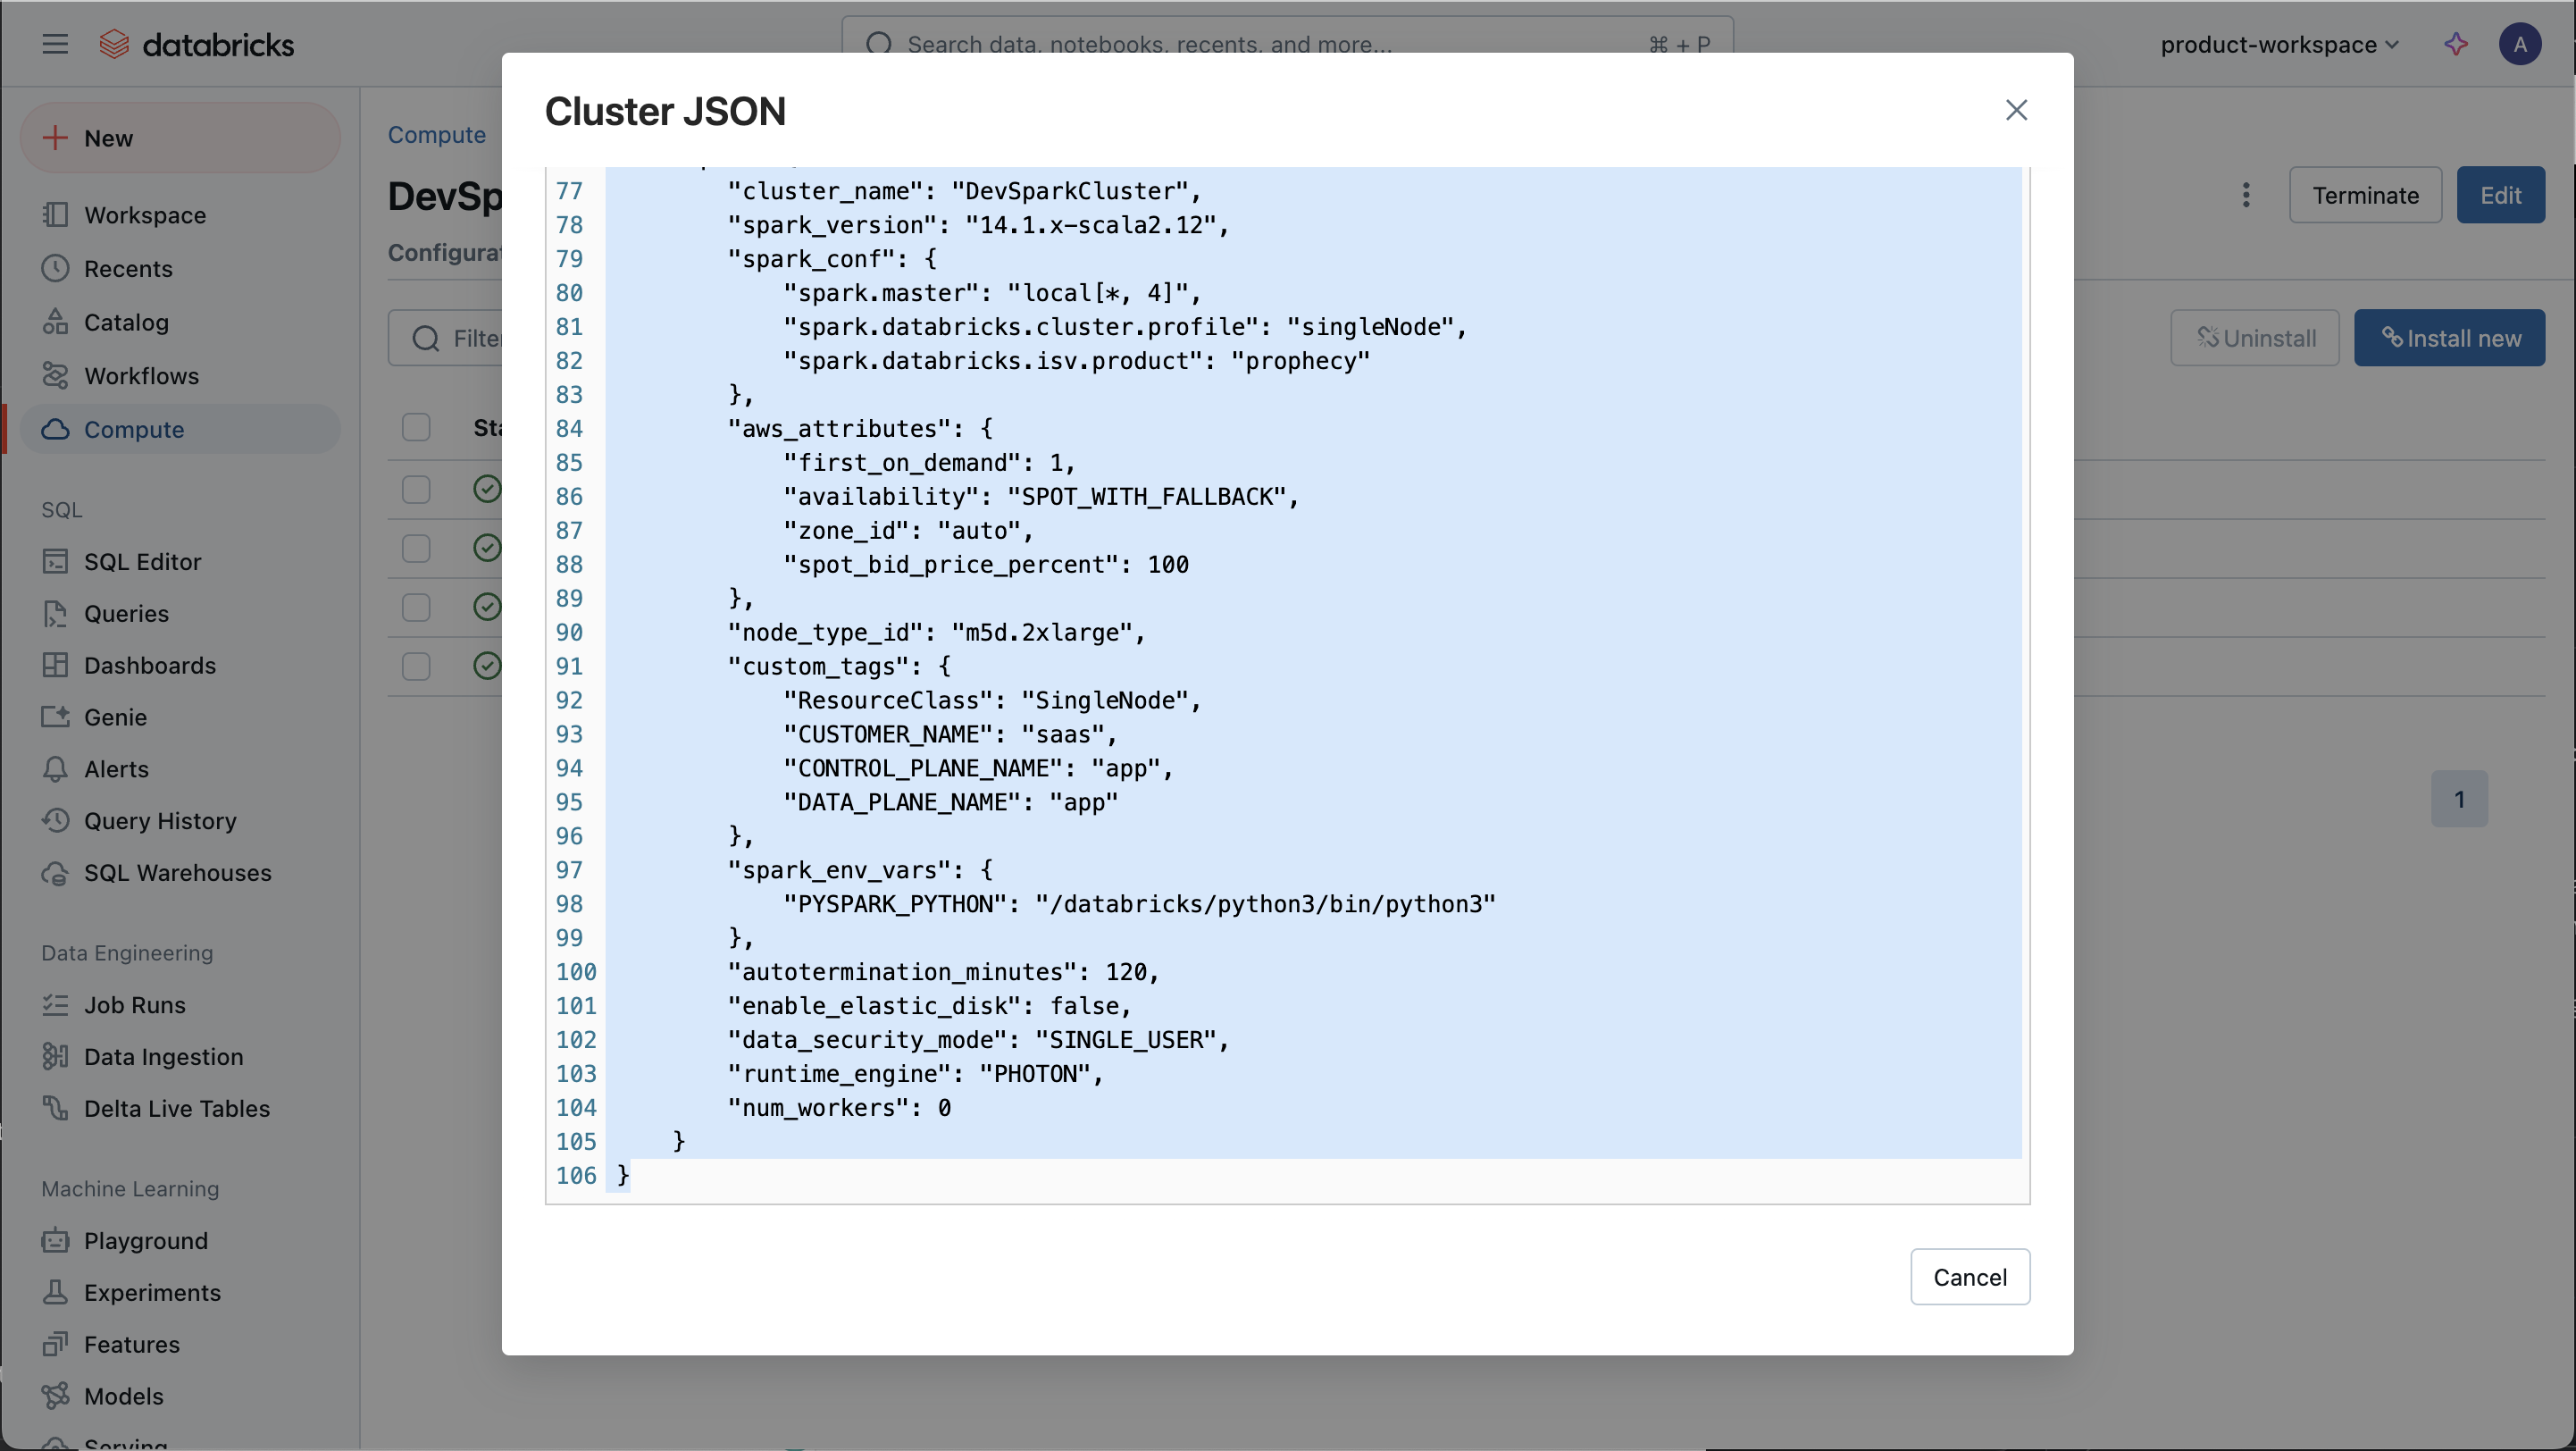
| Cluster JSON (edited to remove any private or sensitive information) |  |
| Libraries installed on the cluster |  |
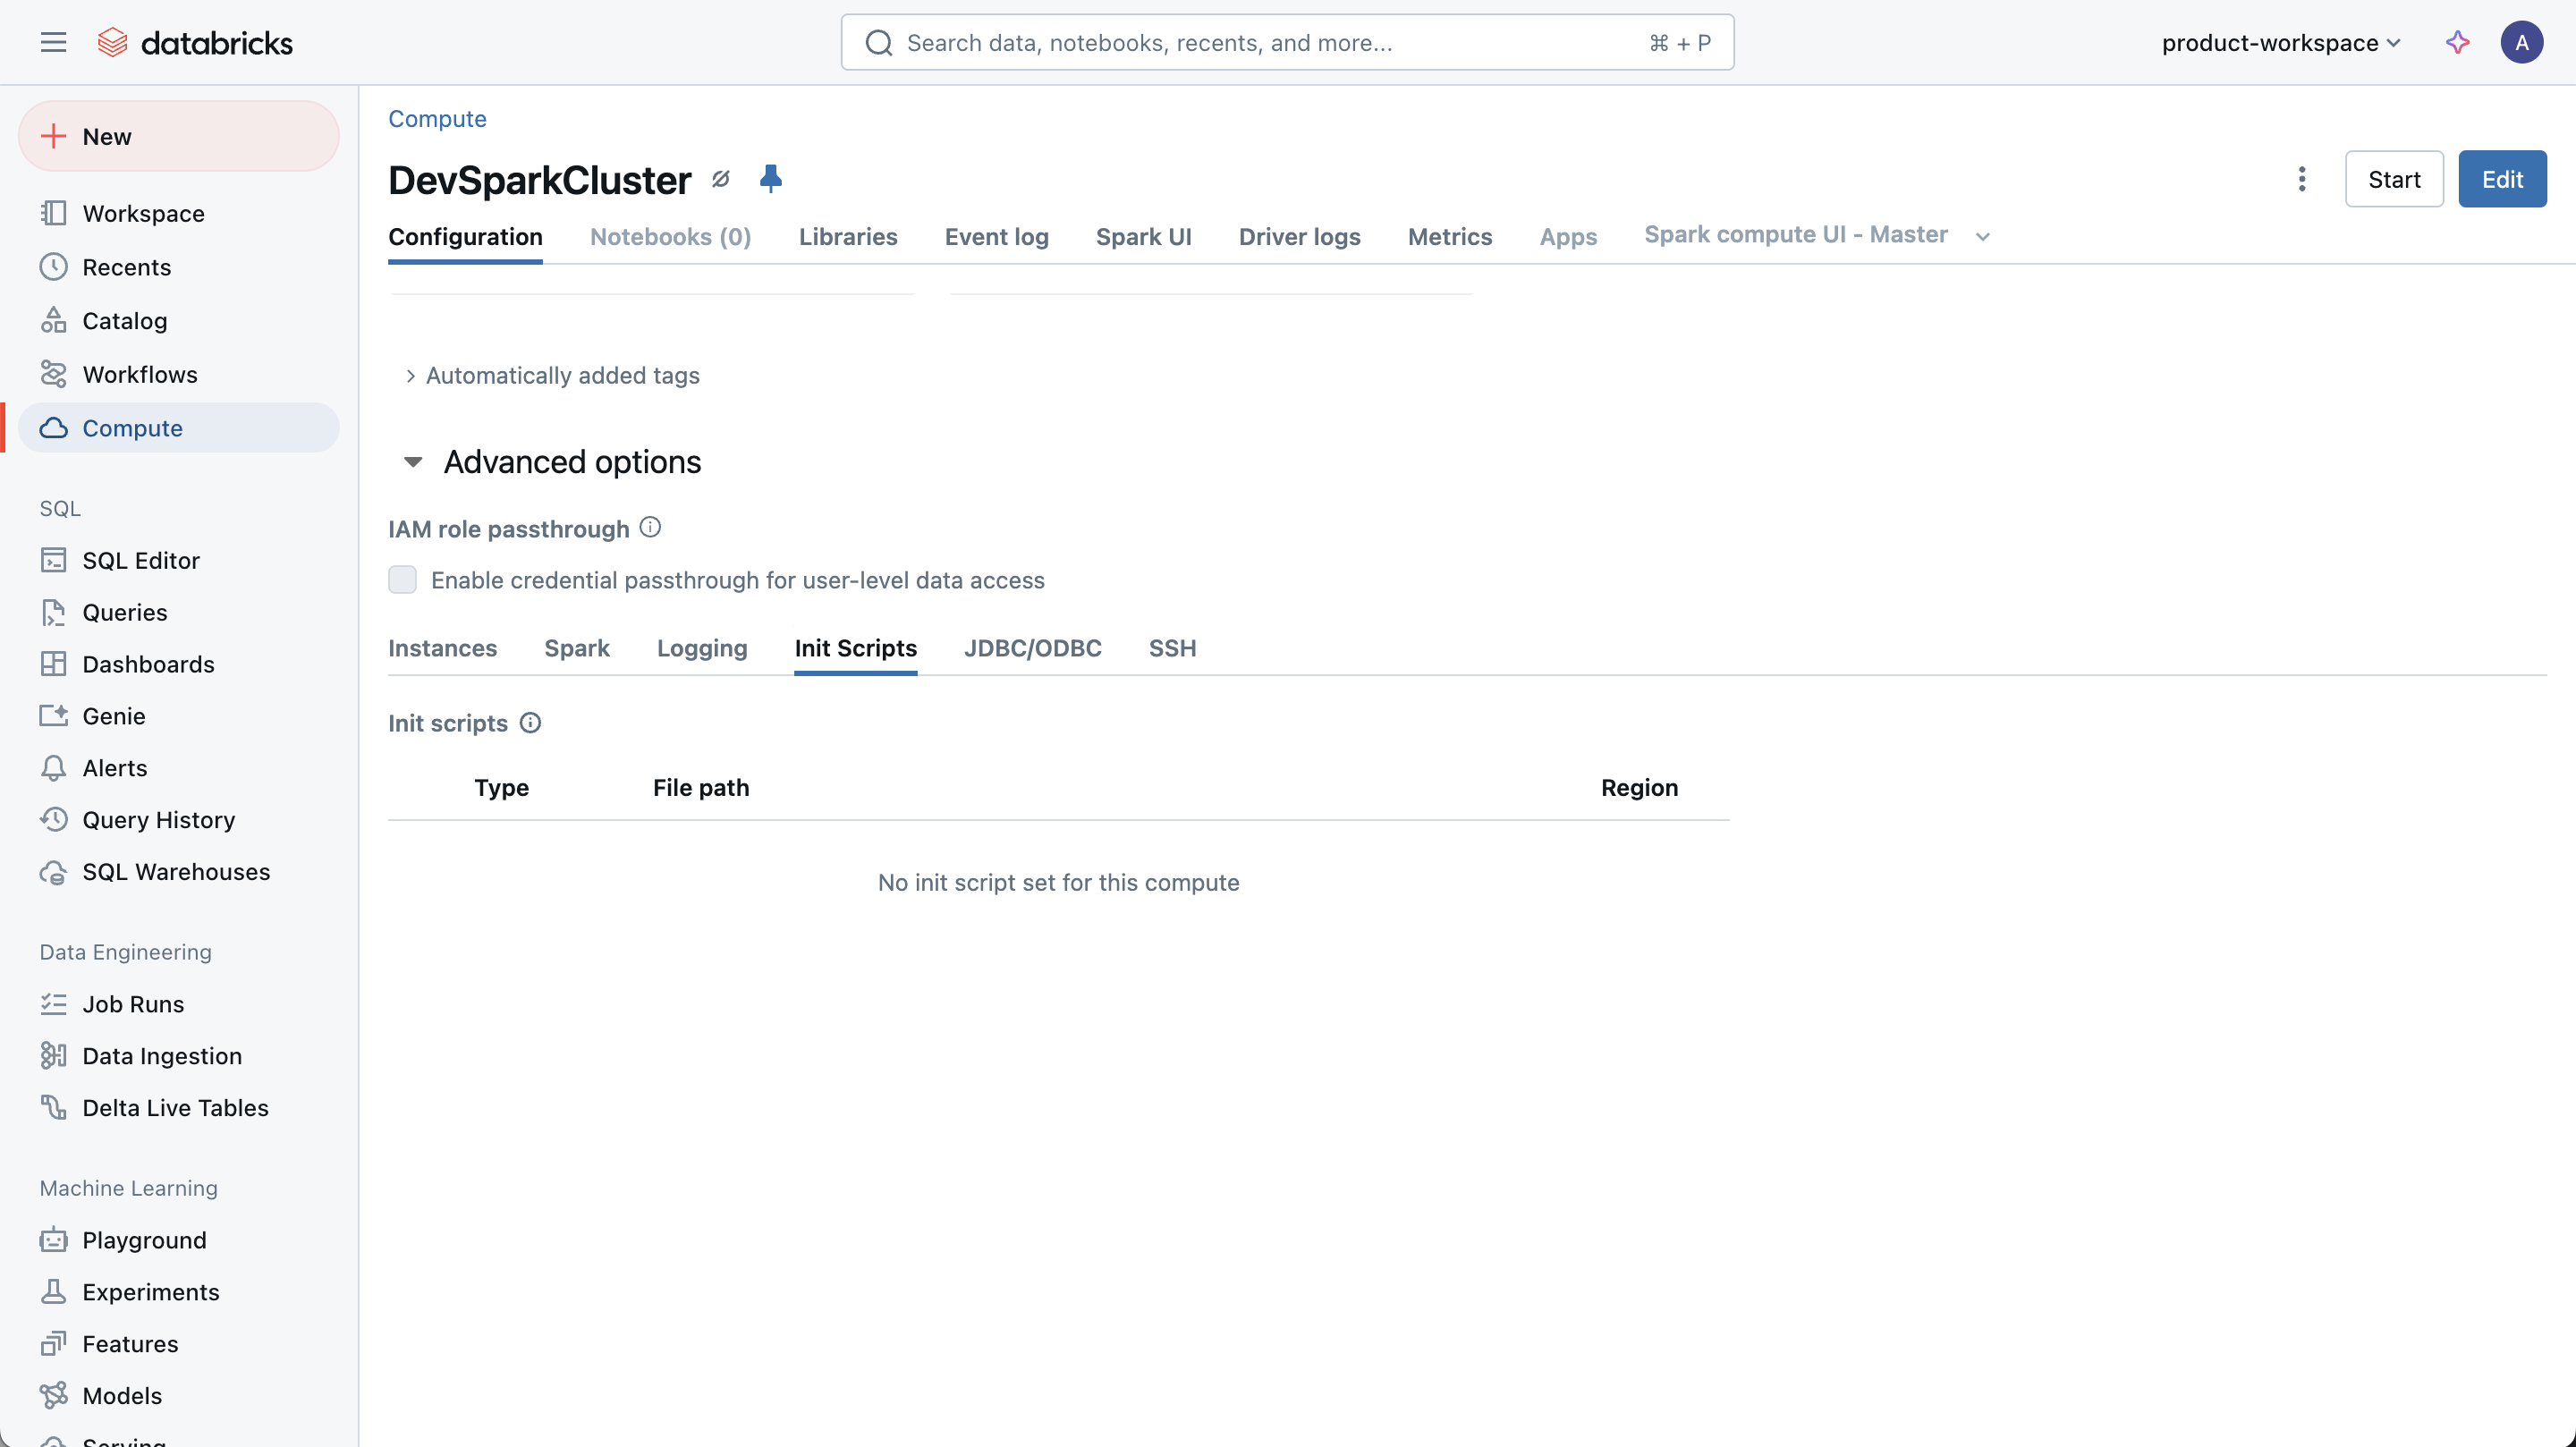
| Init scripts run on the cluster. Include the script itself if possible. |  |
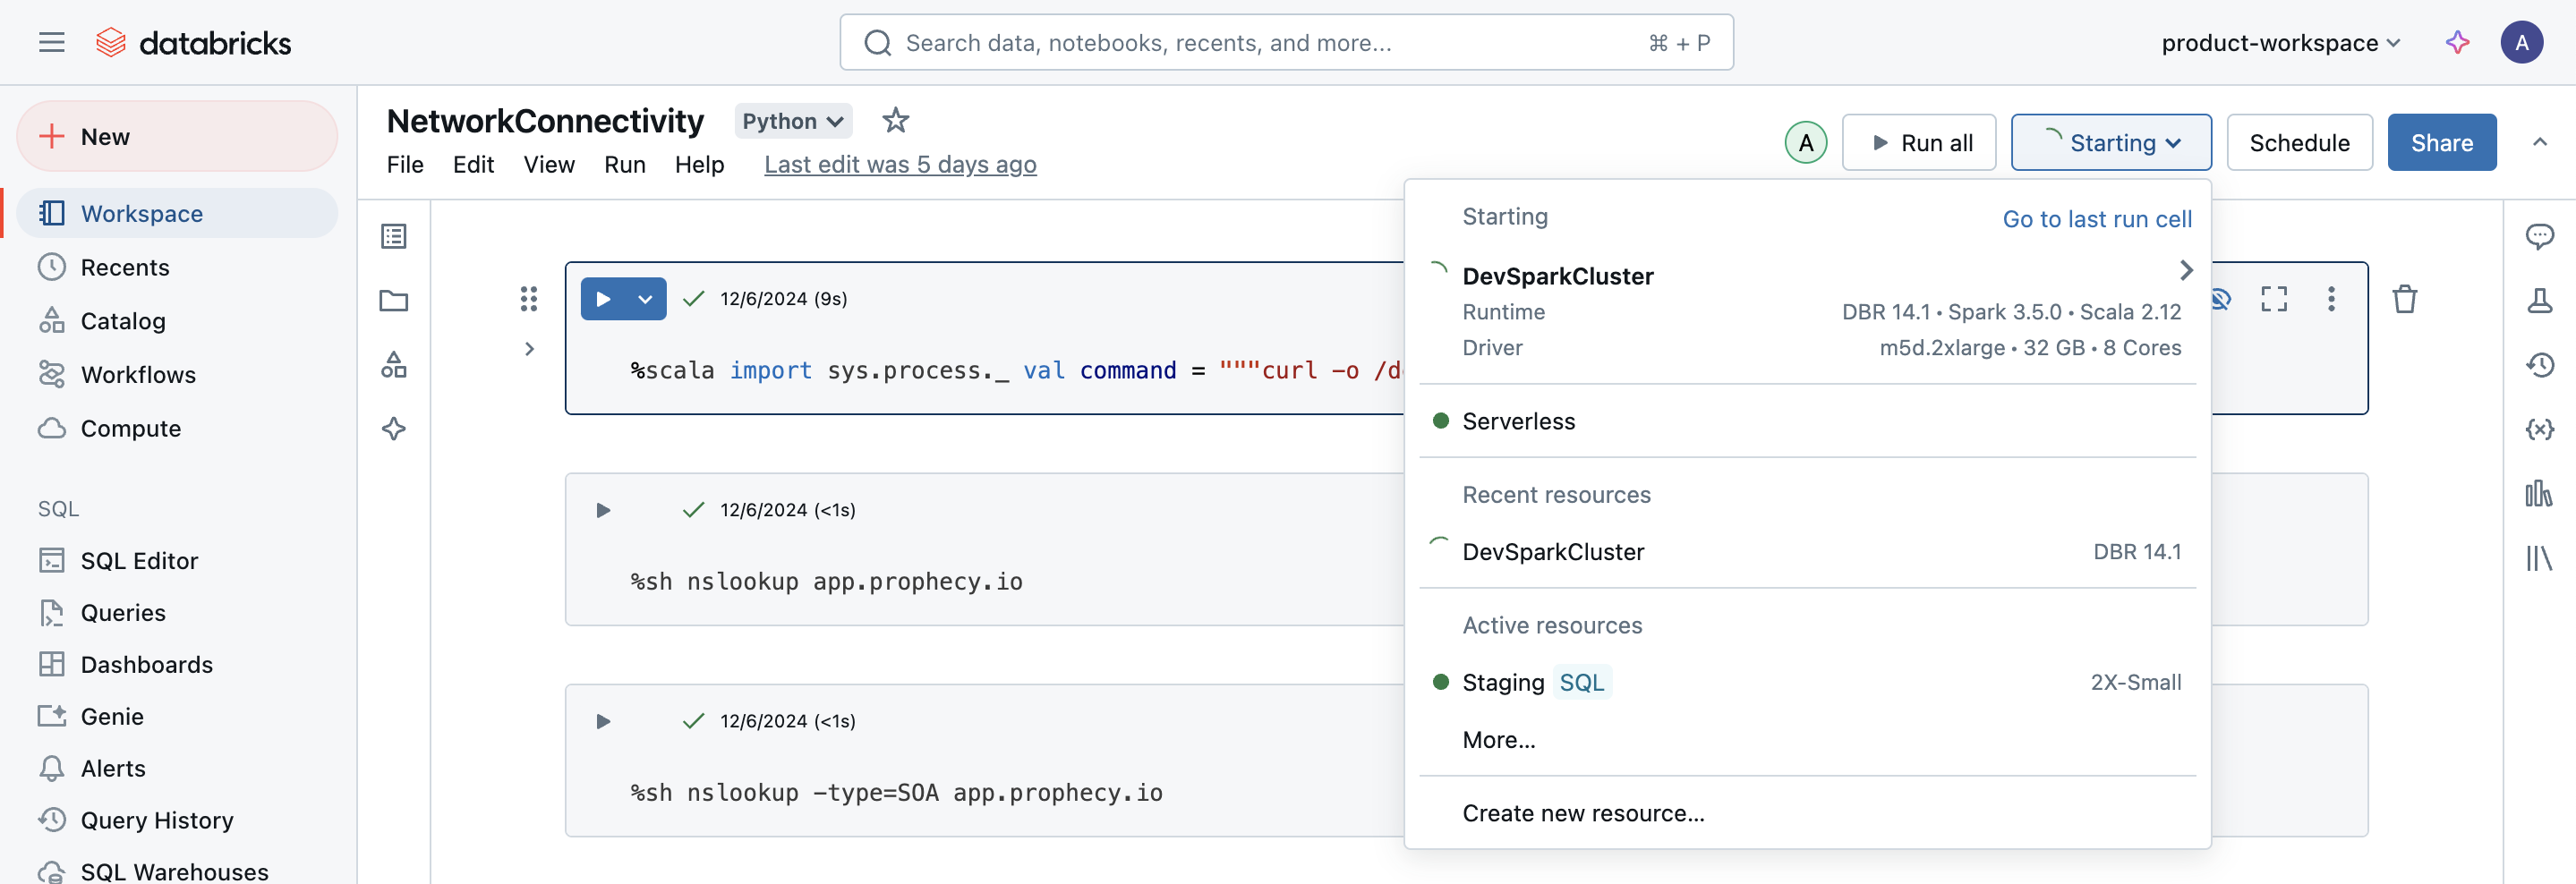
| Output of attaching cluster in a notebook. You may need to duplicate the tab and try attaching the same cluster in the duplicate tab. |  |
Run a notebook
For those who prefer to use code, create a notebook (example below) and send the output via the Prophecy Support Portal.
Replace the workspace URL, personal access token, clusterID, and API token as appropriate.
Python
# Databricks notebook source
import requests

#Get Databricks runtime of cluster
# Get the notebook context using dbutils
context = dbutils.notebook.entry_point.getDbutils().notebook().getContext()

# Retrieve the Databricks runtime version from the context tags
runtime_version = context.tags().get("sparkVersion").get()

# Print the runtime version
print(f"Databricks Runtime Version: {runtime_version}")

# Get Spark version
spark_version = spark.version
print(f"Spark Version: {spark_version}")


#Get the installed libraries and access mode details of the cluster
# Replace with your Databricks workspace URL and token
workspace_url = "replace_with_workspace_url"
token = "replace_with_token"
cluster_id = "replace_with_cluster_id"


# API endpoint to get info of installed libraries
url = f"{workspace_url}/api/2.0/libraries/cluster-status"

# Make the API request
response = requests.get(url, headers={"Authorization": f"Bearer {token}"}, params={"cluster_id": cluster_id})

library_info=response.json()
print("Libraries:")
for i in library_info['library_statuses']:
    print(i)

# API endpoint to get access mode details
url = f"{workspace_url}/api/2.1/clusters/get"

# Make the API request
response = requests.get(url, headers={"Authorization": f"Bearer {token}"}, params={"cluster_id": cluster_id})

cluster_access_info=response.json()
print(f"Cluster Access Mode: {cluster_access_info['data_security_mode']}")
Connectivity Check
Open a notebook on the Spark cluster and run the following command.
Replace the Prophecy endpoint.
- Python
- Scala
import subprocess

command = 'curl -X GET "https://customer_prophecy_url/execution"'
output = subprocess.check_output(['/bin/bash', '-c', command], text=True)

print(output)
%scala
import sys.process._
val command = """curl -X GET "https://customer_prophecy_url/execution""""
Seq("/bin/bash", "-c", command).!!
This command tests the reverse websocket protocol required by Prophecy to execute pipelines on Spark clusters. Please send the output from this command in the Support Portal.
We look forward to hearing from you!