Runtime logs
Runtime logs are generated in real time during pipeline execution and provide a step-by-step trace of how each transformation or action was performed. These logs help you quickly identify which steps succeeded or failed, how long each step took, and whether the execution followed the expected sequence. They're also useful for reviewing pipelines you didn’t build yourself, so you can see what happened during the run.
Understand log entries
You can open runtime logs from the information footer at the bottom of the project editor. Each log entry provides structured details that help you trace execution and diagnose issues. Logs include:
- Pipeline steps: Execution details for every processing step, mapped directly to the gems in your visual pipeline.
- Execution sequence: The exact order in which steps were carried out.
- Timestamp: The start time of each step.
- Duration: How long each step took.
When an error occurs, the message usually comes directly from the execution engine. For example, if your pipeline is running on a Databricks SQL warehouse, errors will originate from Databricks. If you’re using Prophecy In Memory, errors will come from DuckDB (the underlying warehouse). For deeper troubleshooting, consult the corresponding warehouse’s documentation to interpret the error details.
You can also see runtime log information by hovering over each gem in the pipeline canvas. This shows the duration and success/failure status of that step in the most recent run. Use this to quickly spot bottlenecks, failed operations, or unusually slow steps without opening the full log view.
Log UI
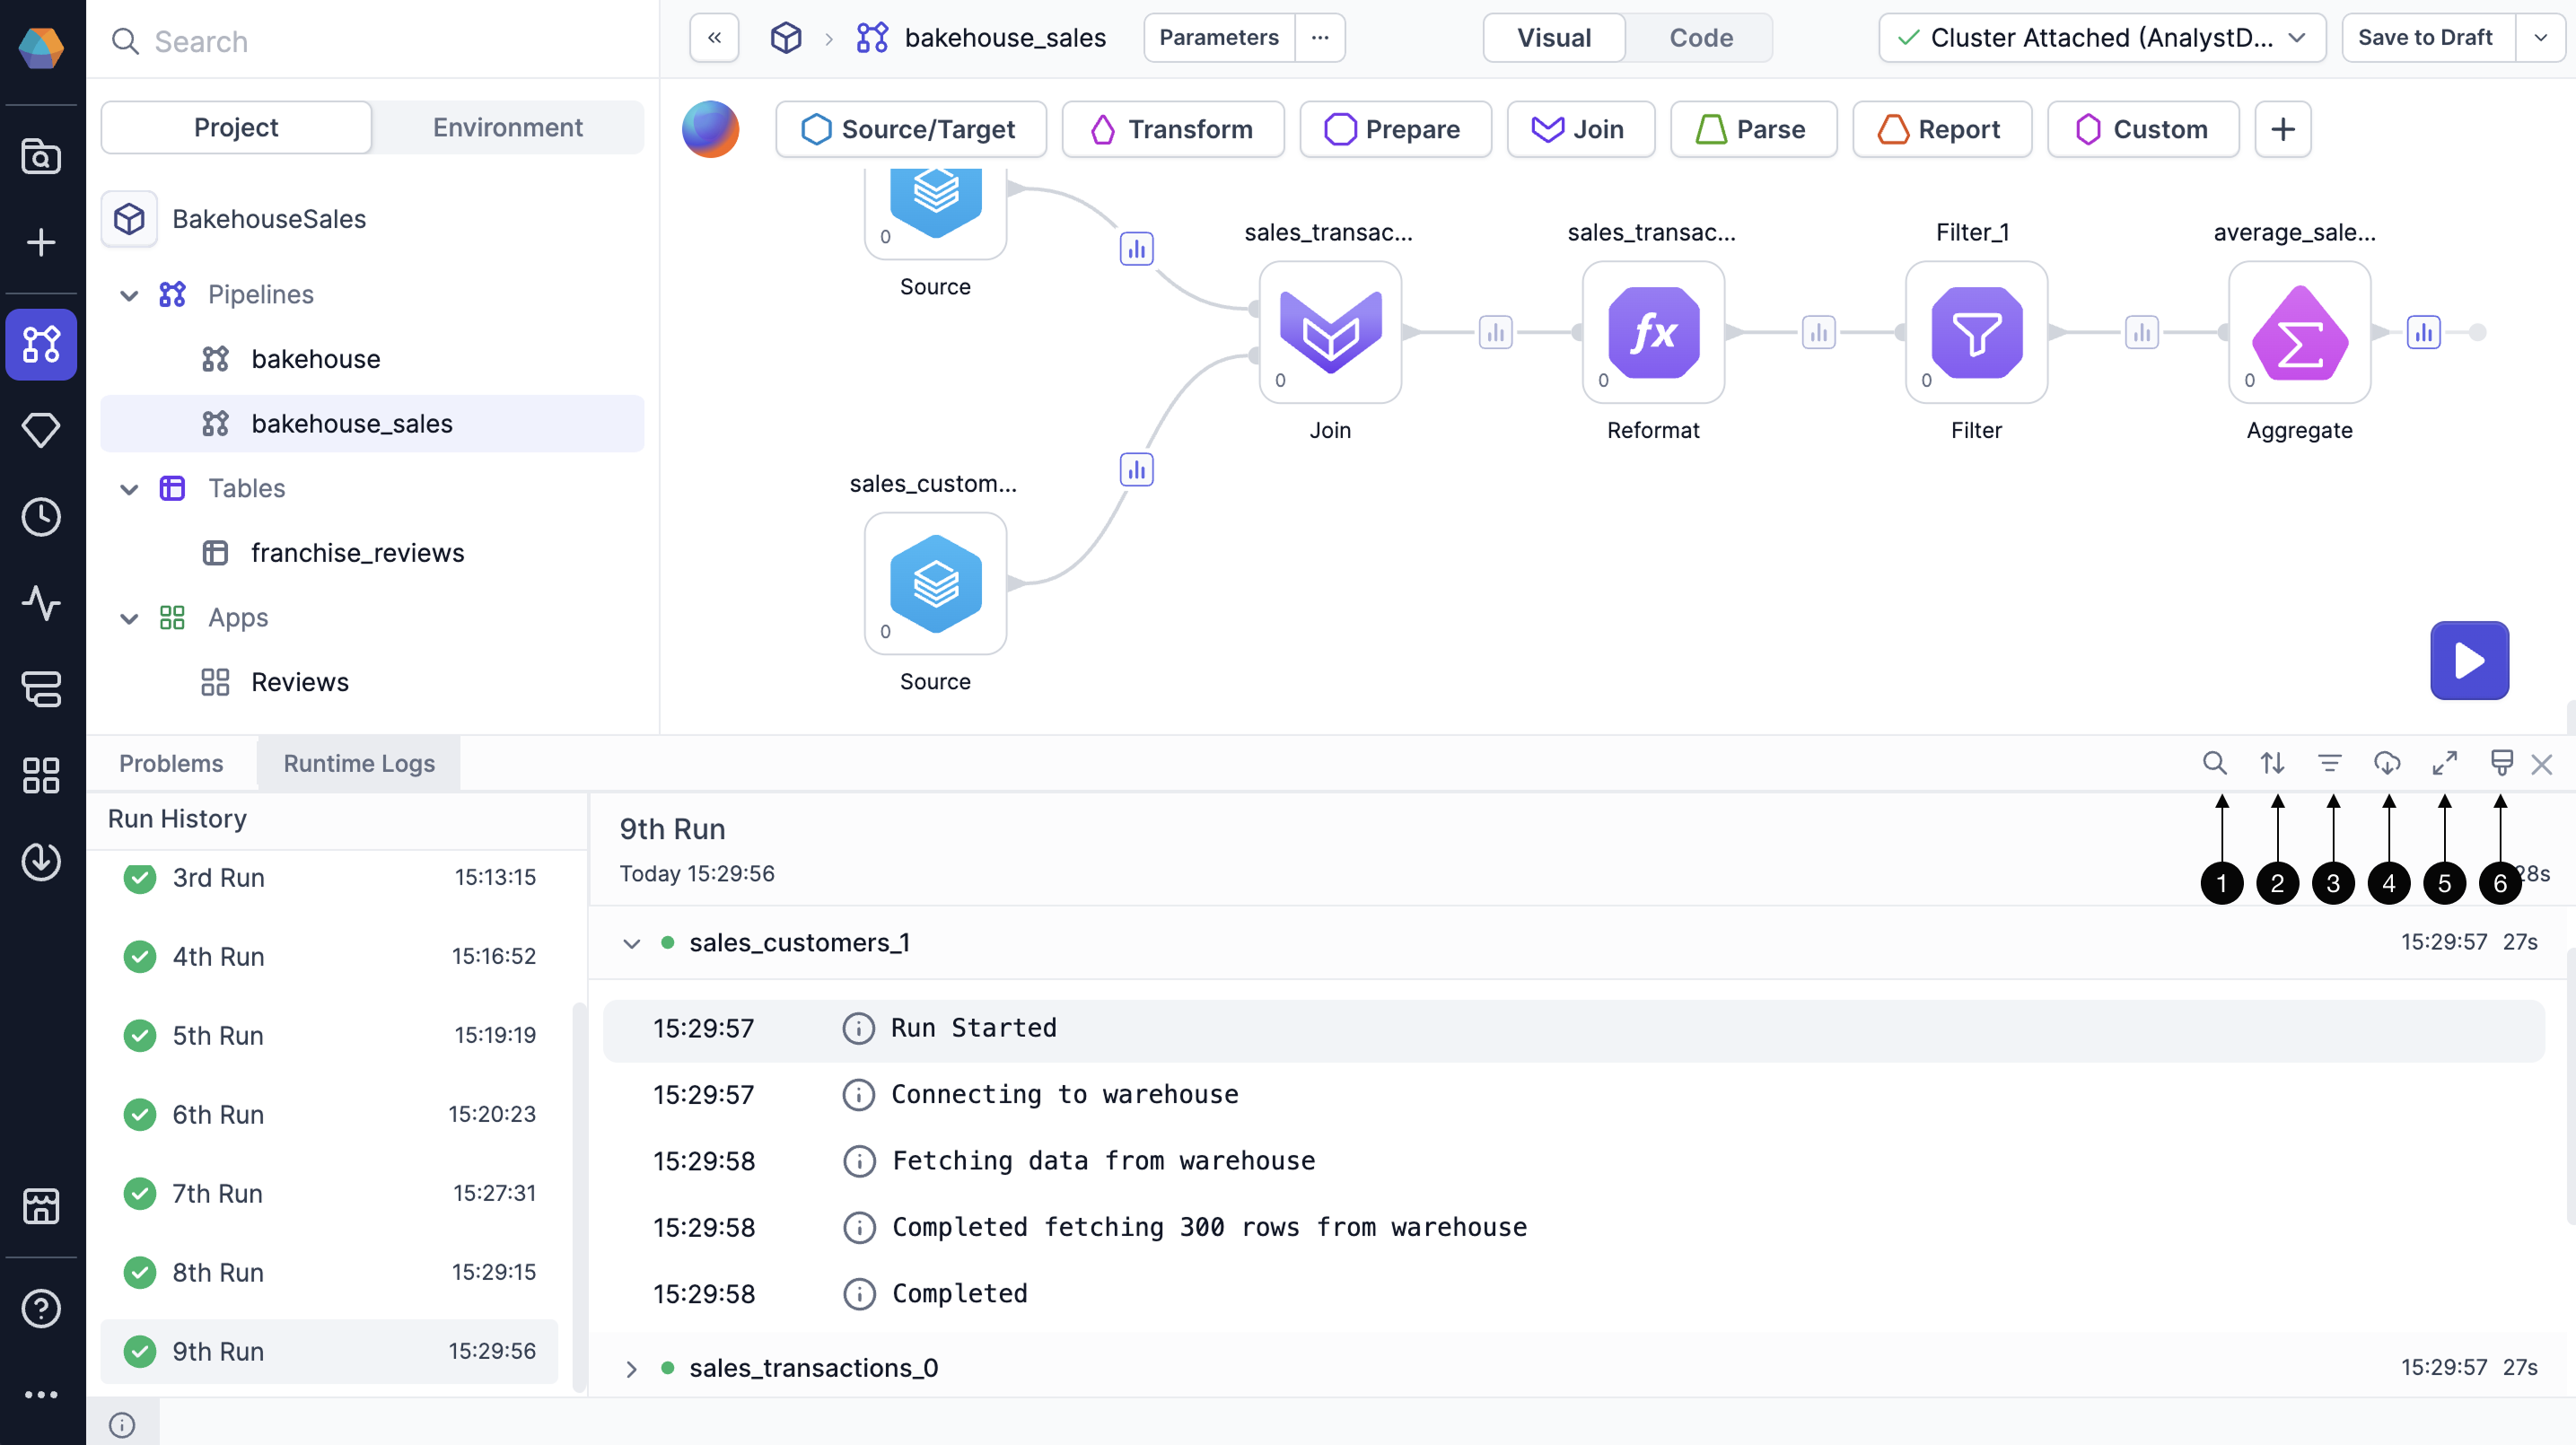
In the Runtime Logs tab, you have several tools to help you navigate and analyze your logs effectively.
- Filter logs by keywords: Find specific information by entering search terms
- Sort logs: Organize logs chronologically
- Filter logs by log level (info, warning, error): Focus on specific types of messages
- Download logs: Save logs to your machine as a text file
- Expand log screen: Display a larger view of your logs
- Clear all logs: Remove log information for previous runs
If your pipeline fails to run, you'll see an error message explaining the reason for the failure displayed at the top of the corresponding log.
SQL warehouse logs
You can find additional logs specific to pipeline queries in your SQL warehouse. If you are connected to a Databricks SQL warehouse, you can find these logs directly in Databricks. This extra visibility into query execution in Databricks helps you troubleshoot pipeline behavior and improve performance.
If you have access to your Databricks workspace:
- Navigate to SQL > Query History in the Databricks sidebar.
- Locate the SQL queries run during your pipeline's execution window.
- Click on a query to see:
- Full SQL query
- Status (Success or Error)
- Start and end times
- Error messages
- Execution plan or profile
What's next
Now that you know about runtime and publish logs, you might want to learn about audit logs and system logs, which provide visibility into platform-level and administrative activity.
-
Audit logs track events across entities like projects, pipelines, jobs, and fabrics. These logs help administrators understand who did what and when. For example, these logs can capture who creates a pipeline, releases a project, modifies a dataset, etc.
-
System logs capture backend infrastructure details to support platform monitoring and troubleshooting. These include Kubernetes cluster configuration (such as resource quotas and node settings), cluster custom resources, config maps and files, and resource consumption metrics.
Unlike runtime logs, which focus on the execution of a specific pipeline run, audit and system logs provide a broader view of how users and the platform are operating over time.