Knowledge graph
Copilot works by enhancing prompts using a knowledge graph, or an internal map of your data environment. This gives Copilot the context it needs to generate accurate, relevant answers.
Prophecy generates knowledge graphs for SQL projects only. Knowledge graphs are not used for Spark projects.
Overview
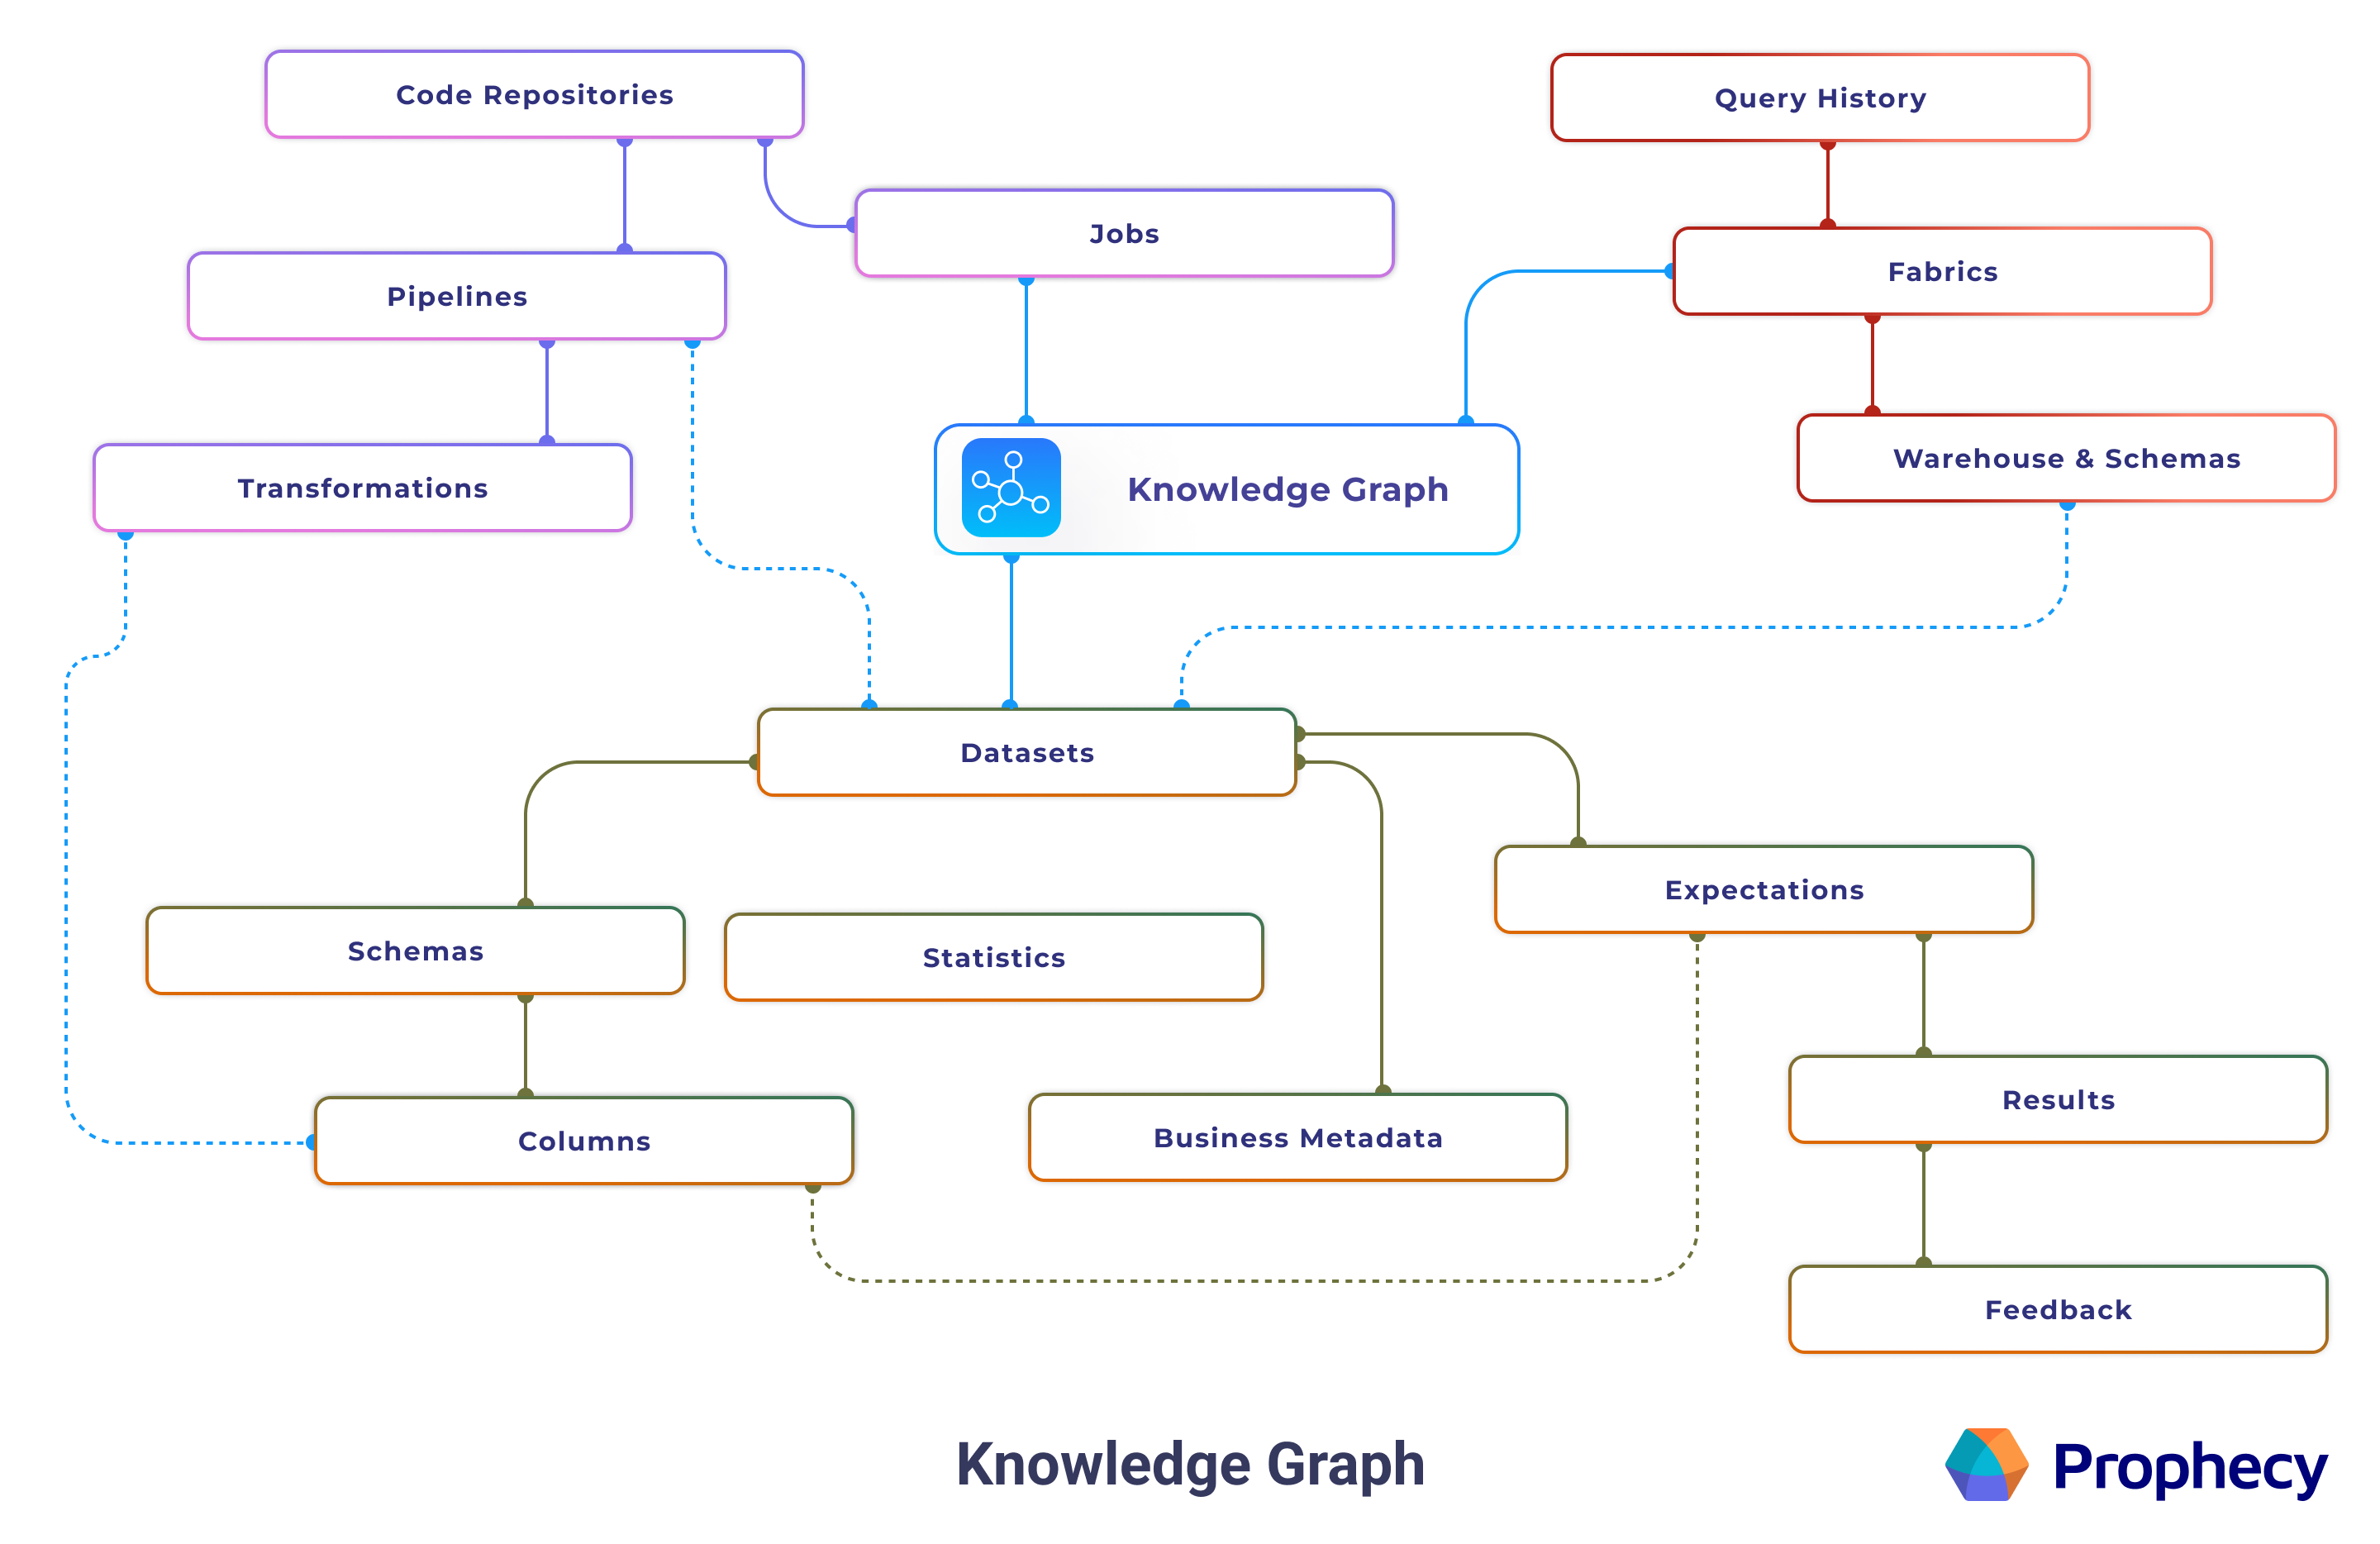
Knowledge graphs are generated per fabric in Prophecy. Each knowledge graph contains information from fabrics and other entities, including the statistical usages of these entities. It also contains computed fields that further refine Copilot's capabilities.
Your data is never stored in the knowledge graph. For more details, see Security.
Process
When you interact with Copilot, Prophecy follows a multi-step process to generate what you need. First, Copilot enriches your prompt using the knowledge graph. This step adds detailed context about your project’s datasets, schemas, and other entities, which helps the agent understand what you're referring to. The enhanced prompt is then sent to OpenAI’s large language model (LLM), which returns SQL code based on the provided context.
Once the code is generated, Prophecy validates it and automatically corrects any errors when possible. After validation, Prophecy converts the code into a visual pipeline, which is displayed on the canvas for you to review and customize.
Indexing
Prophecy indexes your data environment to build the knowledge graph. In other words, the knowledge graph indexer scans your warehouse and indexes table names, schemas, column names, data types, and other metadata. Prophecy then uses this indexed data to enhance AI prompts.
You can trigger the knowledge graph indexer manually or configure it to run automatically on a schedule. For detailed information about configuring knowledge graph crawling, including authentication setup and scheduling options, see Knowledge graph indexing.