Execution
Applicable to the Enterprise Edition only.
Prophecy executes pipelines based on the type of Spark cluster and the operation being performed. You can run pipelines interactively, schedule them, or execute them using the built-in Spark shell. Each execution provides information through logs and metrics to help you manage and monitor data transformations.
Interactive execution
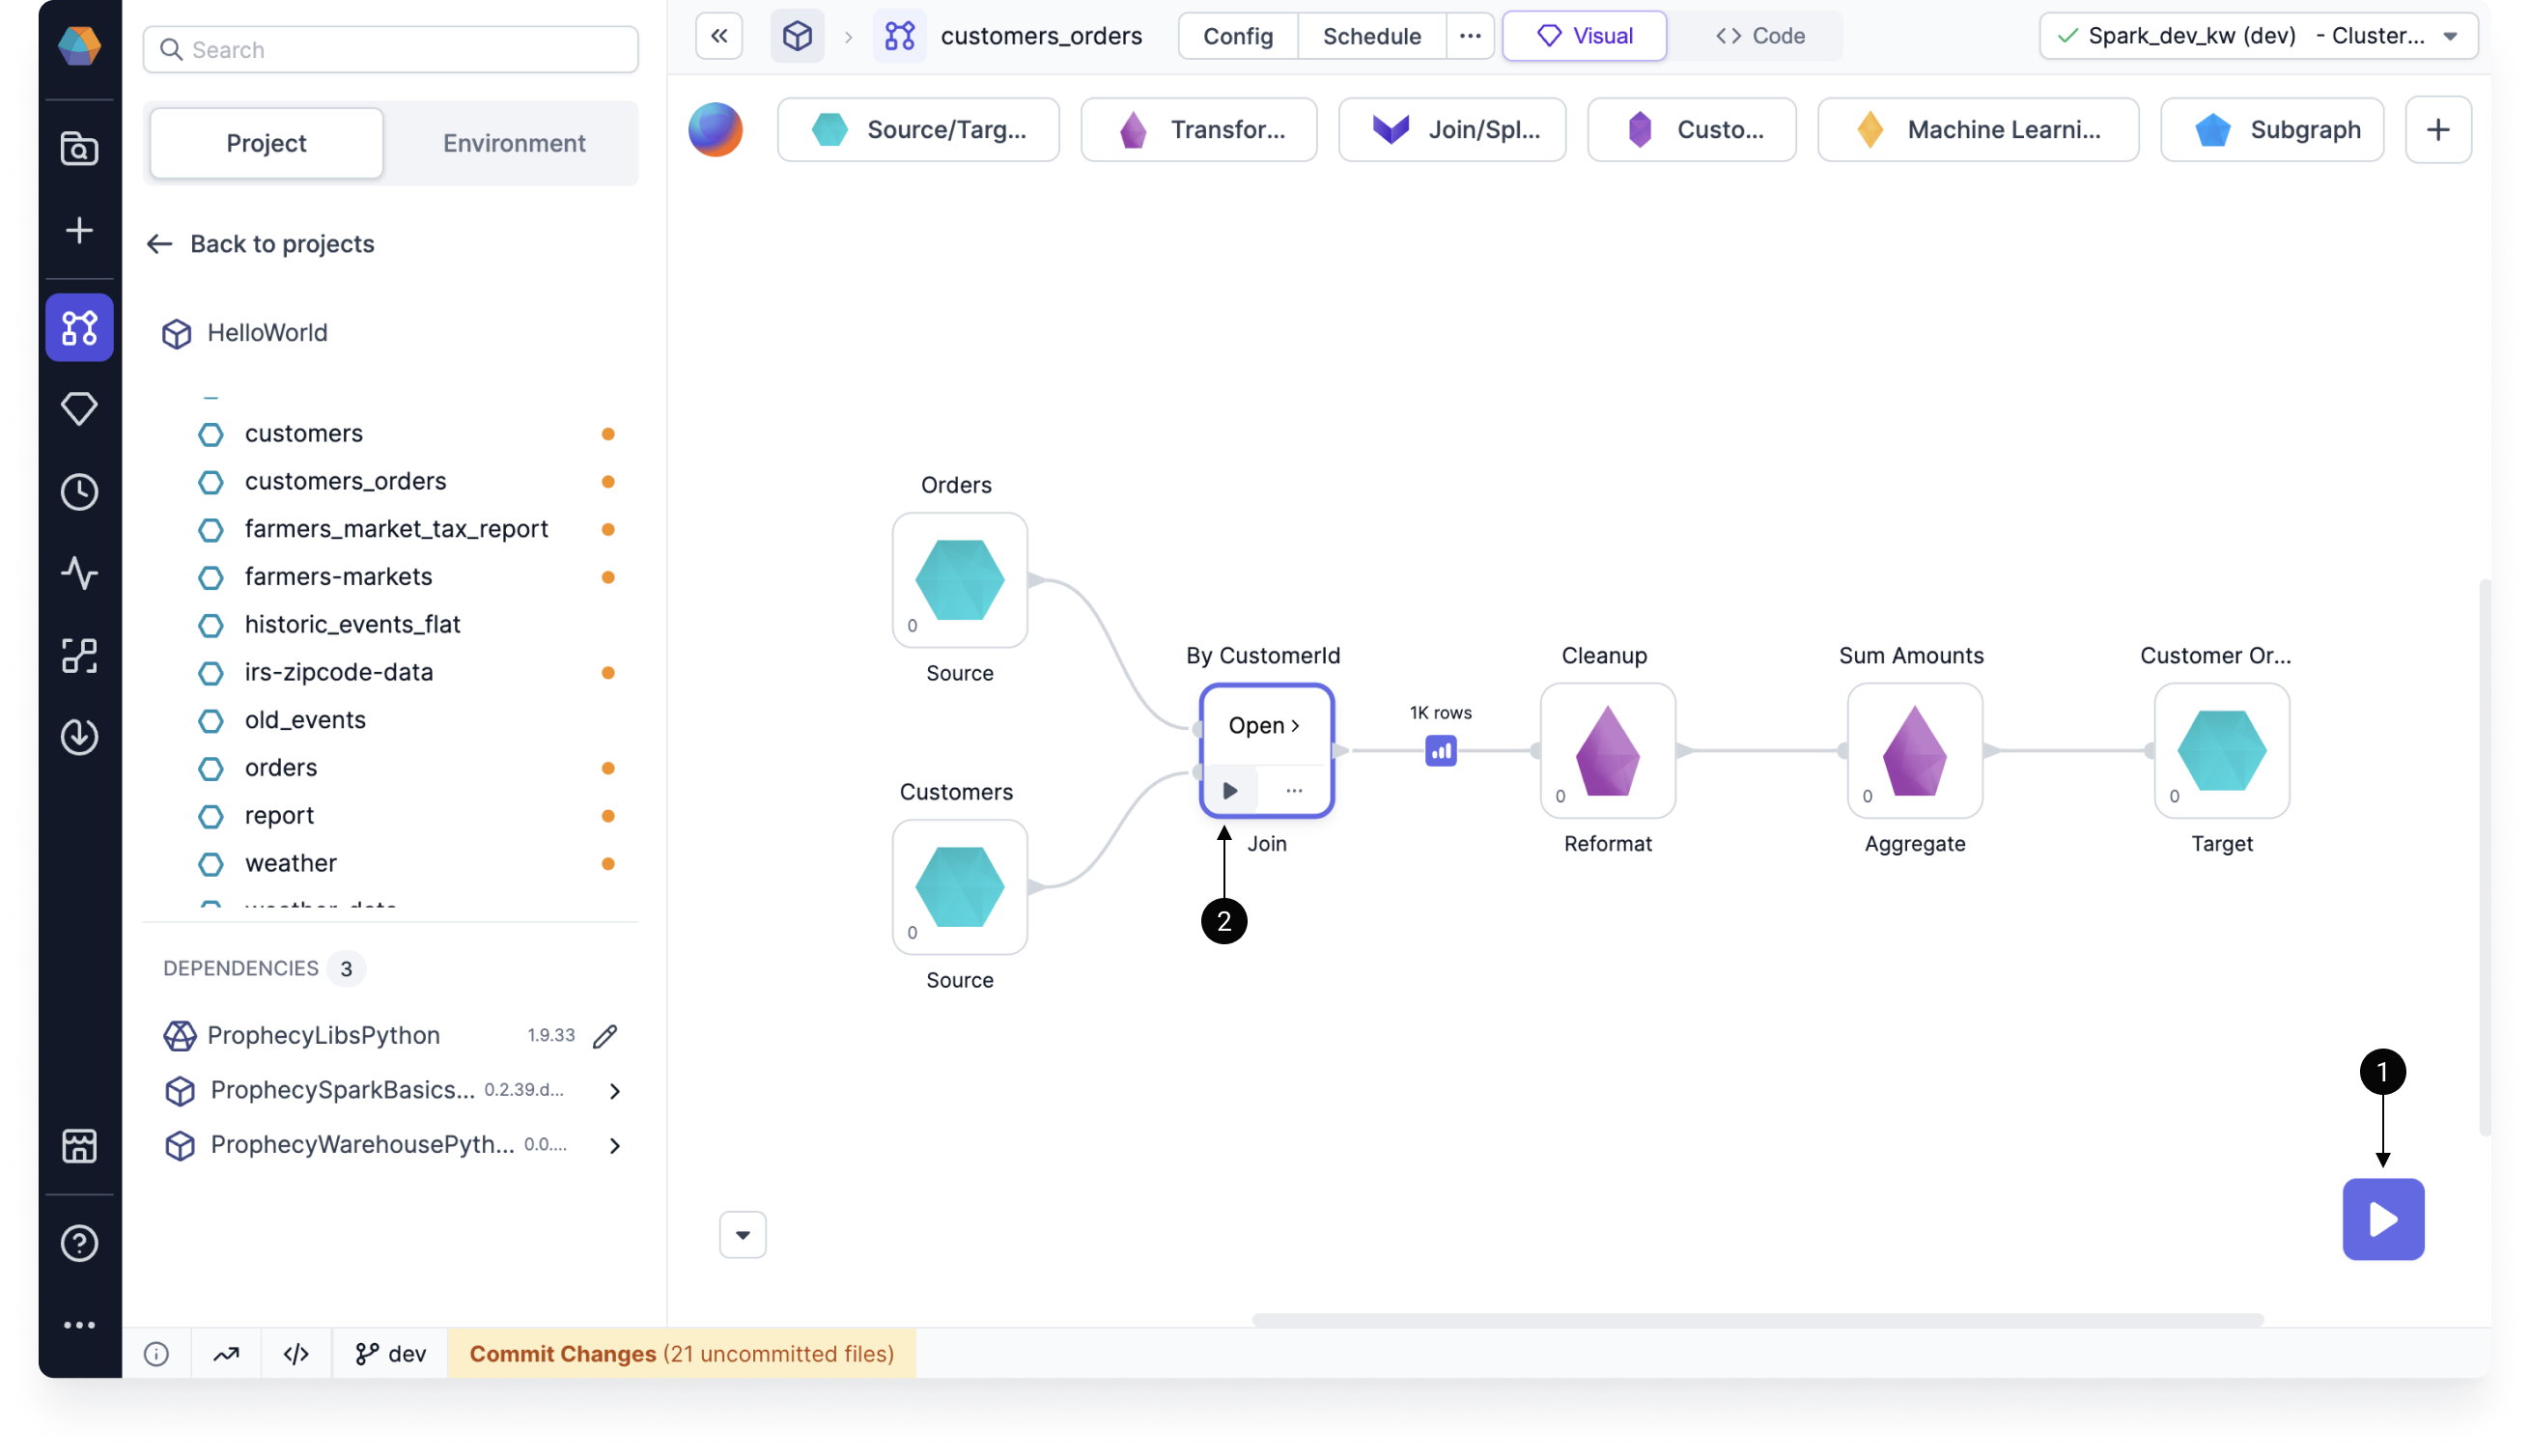
When you run a pipeline in the pipeline canvas, Prophecy generates interim data samples that let you preview the output of your data transformations. There are two ways to run a pipeline interactively:
- Click the large play button on bottom of the pipeline canvas. The whole pipeline runs.
- Click the play button on a gem. All gems up to and including that gem run. This is a partial pipeline run.
After you run your pipeline interactively in the canvas, data samples will appear between gems. These previews are temporarily cached. Learn about how these data samples are generated or discover the Data Explorer.
Gem execution order
When pipelines have multiple branches, gems execute sequentially, rather than running in parallel. You can visualize this sequence by switching to the Code view of your pipeline, where operations appear in their exact execution order.
def pipeline(spark: SparkSession) -> None:
    df_Orders = Orders(spark)
    df_Customers = Customers(spark)
    df_By_CustomerId = By_CustomerId(spark, df_Orders, df_Customers)
    df_Cleanup = Cleanup(spark, df_By_CustomerId)
    df_Sum_Amounts = Sum_Amounts(spark, df_Cleanup)
    Customer_Orders(spark, df_Sum_Amounts)
In this example, each step executes completely before the next one begins:
- Step 1 (Orders) runs and completes entirely
- Step 2 (Customers) runs only after Orders finishes
- Step 3 (Join) waits for both previous steps to be complete
- Steps 4, 5, and 6 continue this sequential pattern
The order that you see in the Code view can be changed by manually setting gem phases.
Gems running on Spark are limited to sequential execution. Conversely, when gems run in a SQL warehouse, Prophecy leverages parallel execution when dependencies allow.
Scheduled execution
When you create jobs in Prophecy, you schedule when certain pipelines will run. Prophecy executes pipelines based on the fabric defined in the pipeline's job settings. Prophecy will automatically run jobs once relevant projects are released and deployed.
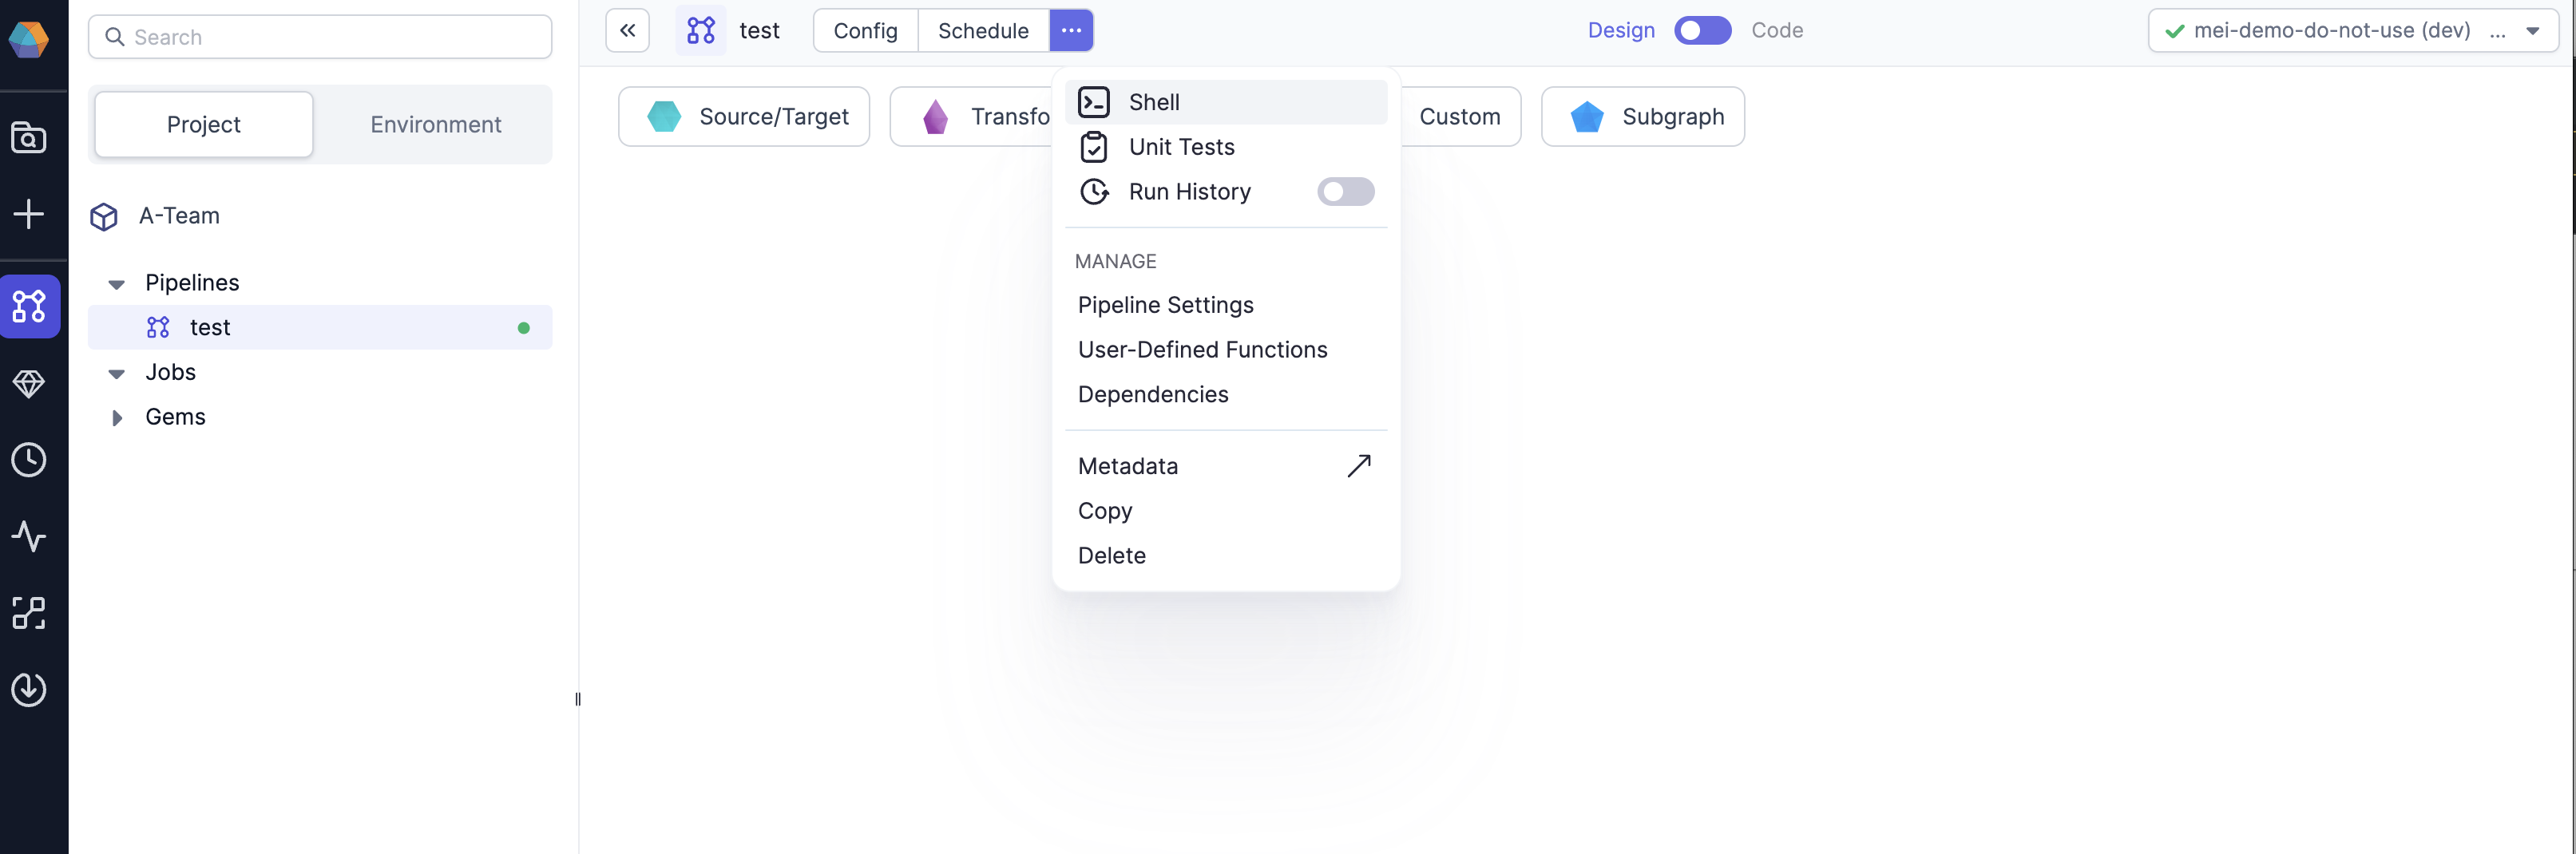
Shell execution
Prophecy comes with an built-in interactive Spark shell that supports both Python and Scala. The shell is an easy way to quickly analyze data or test Spark commands. The Spark context and session are available within the shell as variables sc and spark respectively.
Execution information
Once you run a pipeline, there are several ways for you to better understand the execution.
| Callout | Information | Description |
|---|---|---|
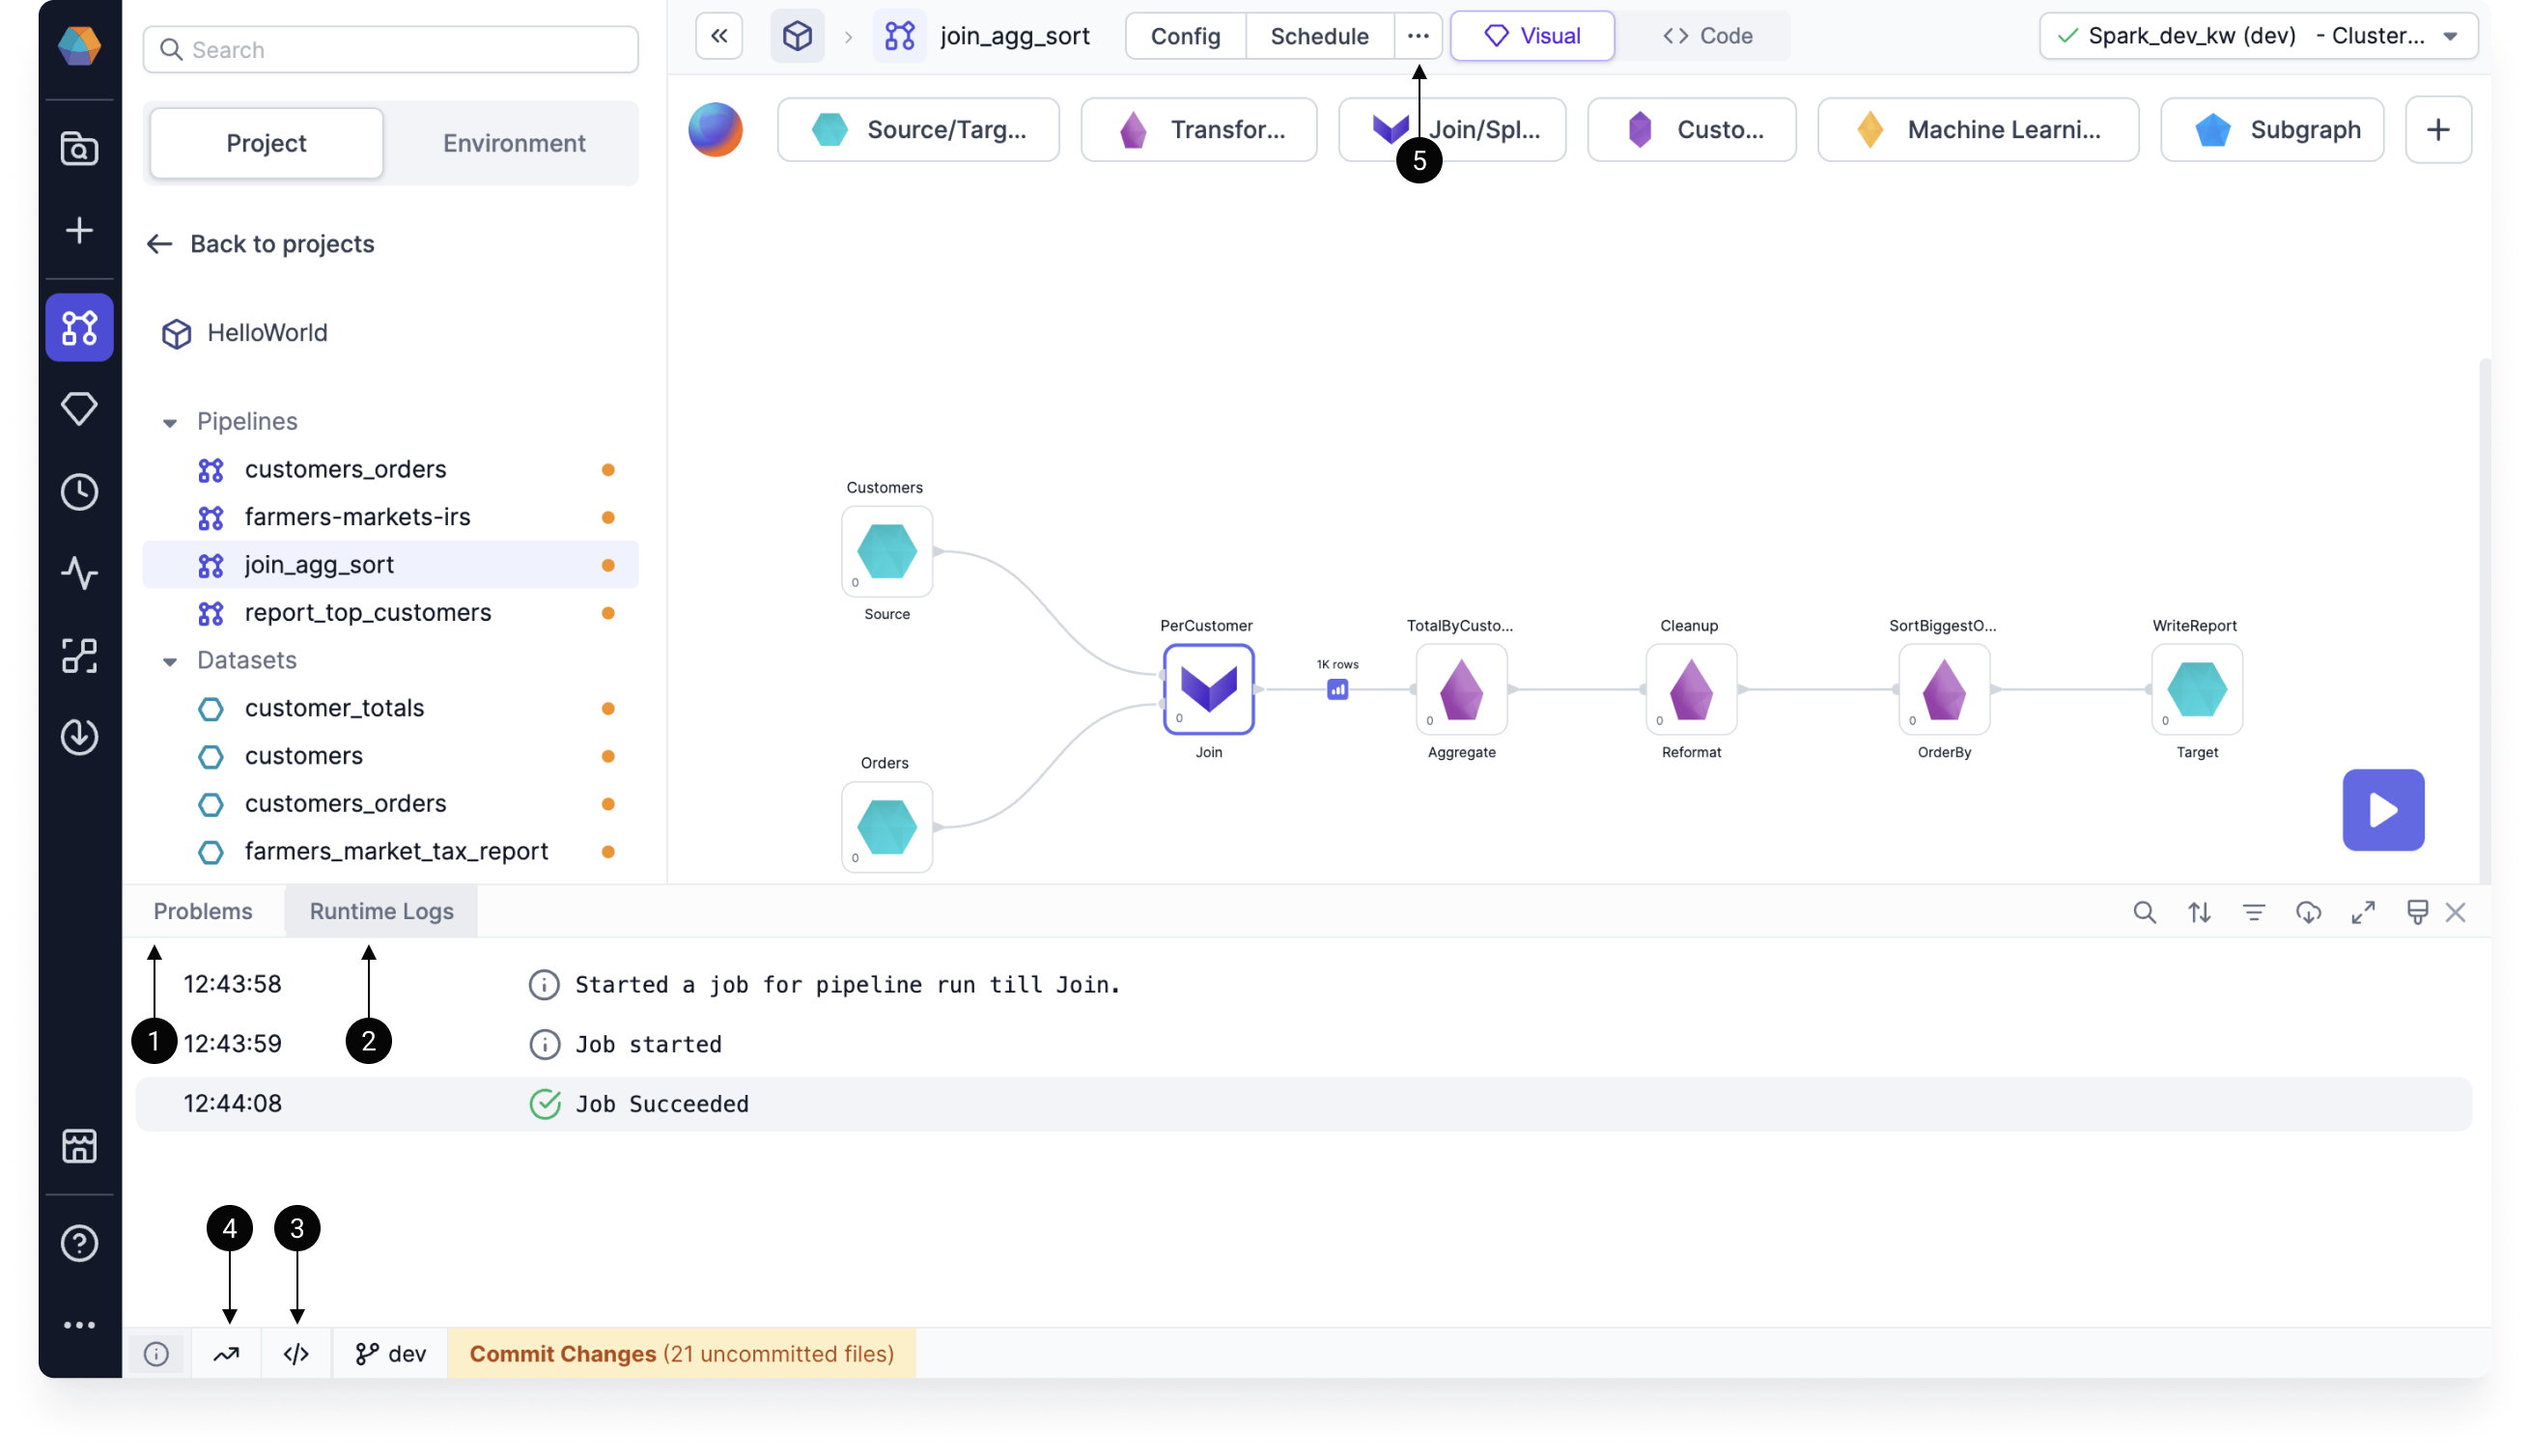
| 1 | Problems | Errors from your pipeline execution that will be shown in a dialog window, as well as in the canvas footer. |
| 2 | Runtime logs | The progress with timestamps of your pipeline runs and any errors. |
| 3 | Execution code | The code Prophecy runs to execute your pipeline. You can copy and paste this code elsewhere for debugging. |
| 4 | Runtime metrics | Various Spark metrics collected during runtime. |
| 5 | Execution metrics | Metrics that can be found in the Metadata of a pipeline, or from the Run History button under the ... menu. |
Use the image below to help you find the relevant information.
Execution on Databricks
Databricks clusters come with various Access Modes. To use Unity Catalog Shared clusters, check for feature support here.
When using High Concurrency or Shared Mode Databricks Clusters you may notice a delay when running the first command, or when your cluster is scaling up to meet demand. This delay is due to Prophecy and pipeline dependencies (Maven or Python packages) being installed. For the best performance, it is recommended that you cache packages in an Artifactory or on DBFS. Please contact us to learn more about this.