Project editor for SQL projects
When you build a pipeline, it helps to be familiar with the project editor interface. The following sections describe each area of the project editor.
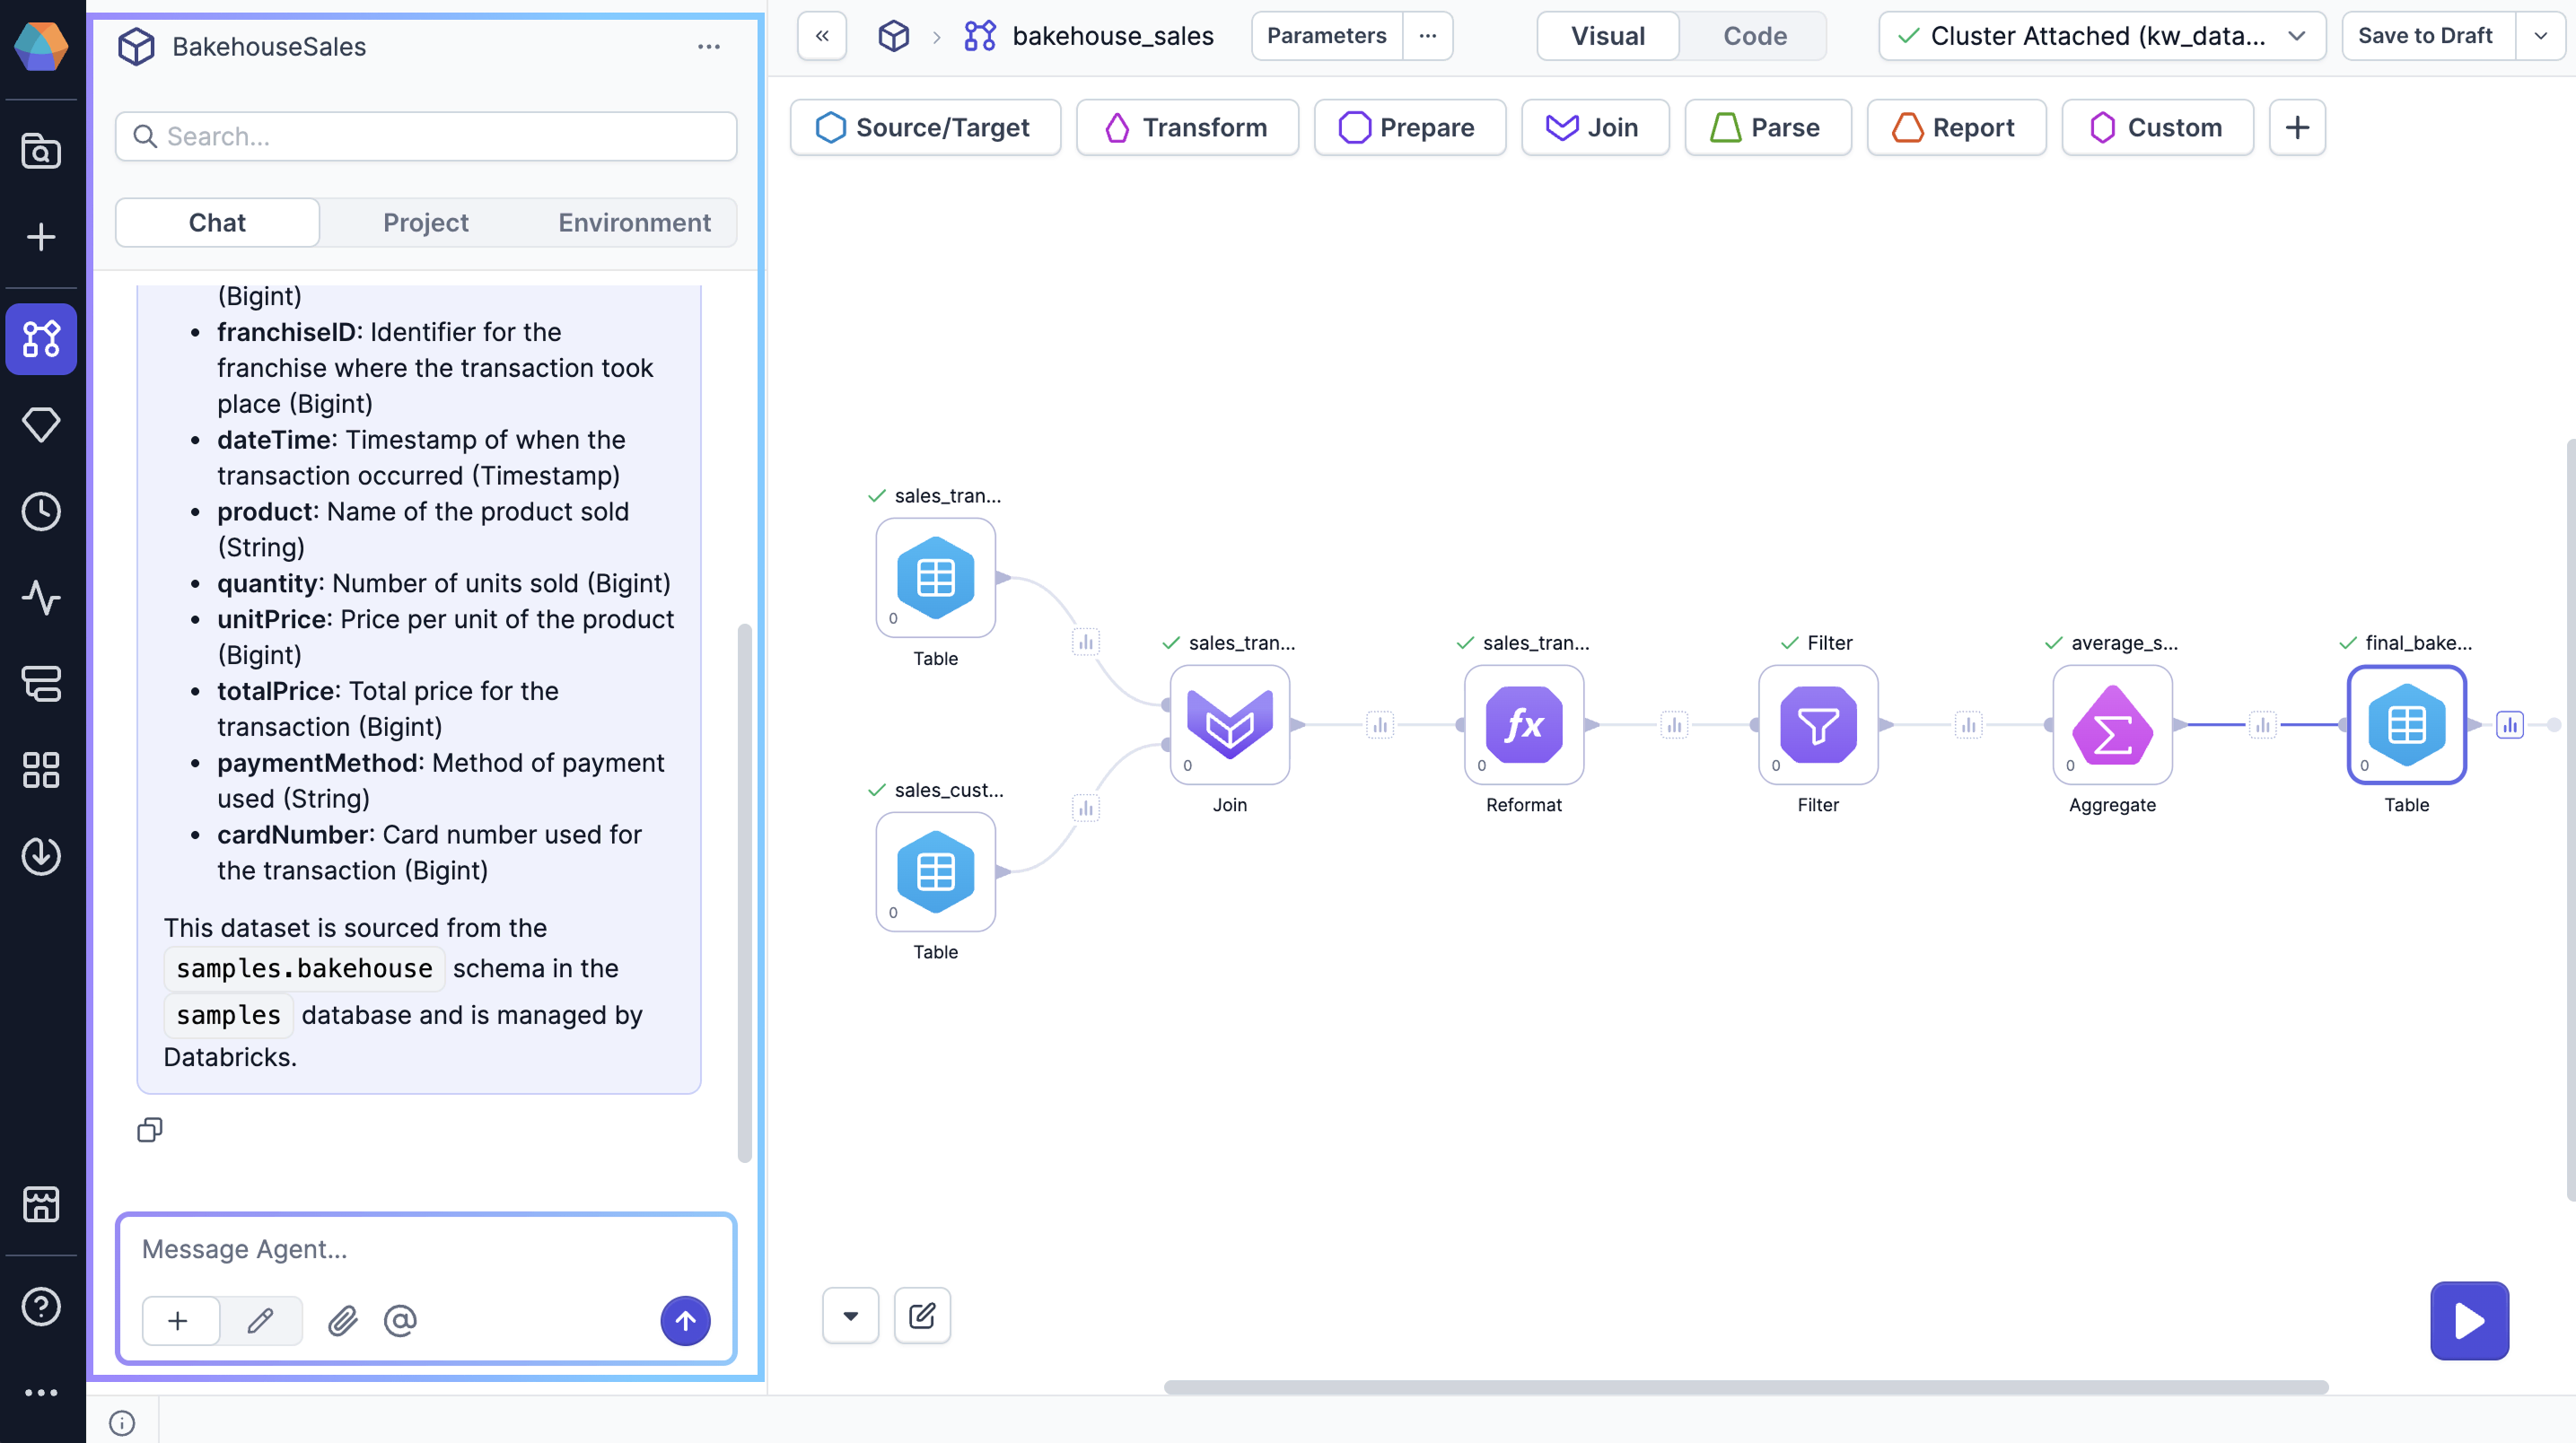
Sidebar
The left sidebar includes the following tabs.
| Tab | Description |
|---|---|
| Chat | The Chat tab lets you interact with Prophecy's AI Agent to accomplish tasks like:
|
| Project | The Project tab allows you to manage all of your project entities. You can view, add, edit, or remove entities from your project, such as pipelines, tables, apps, functions, and more. |
| Environment | The Environment tab lets you access data directly in Prophecy from connections defined in your attached fabric.
... ellipses menu and find the following options:
|
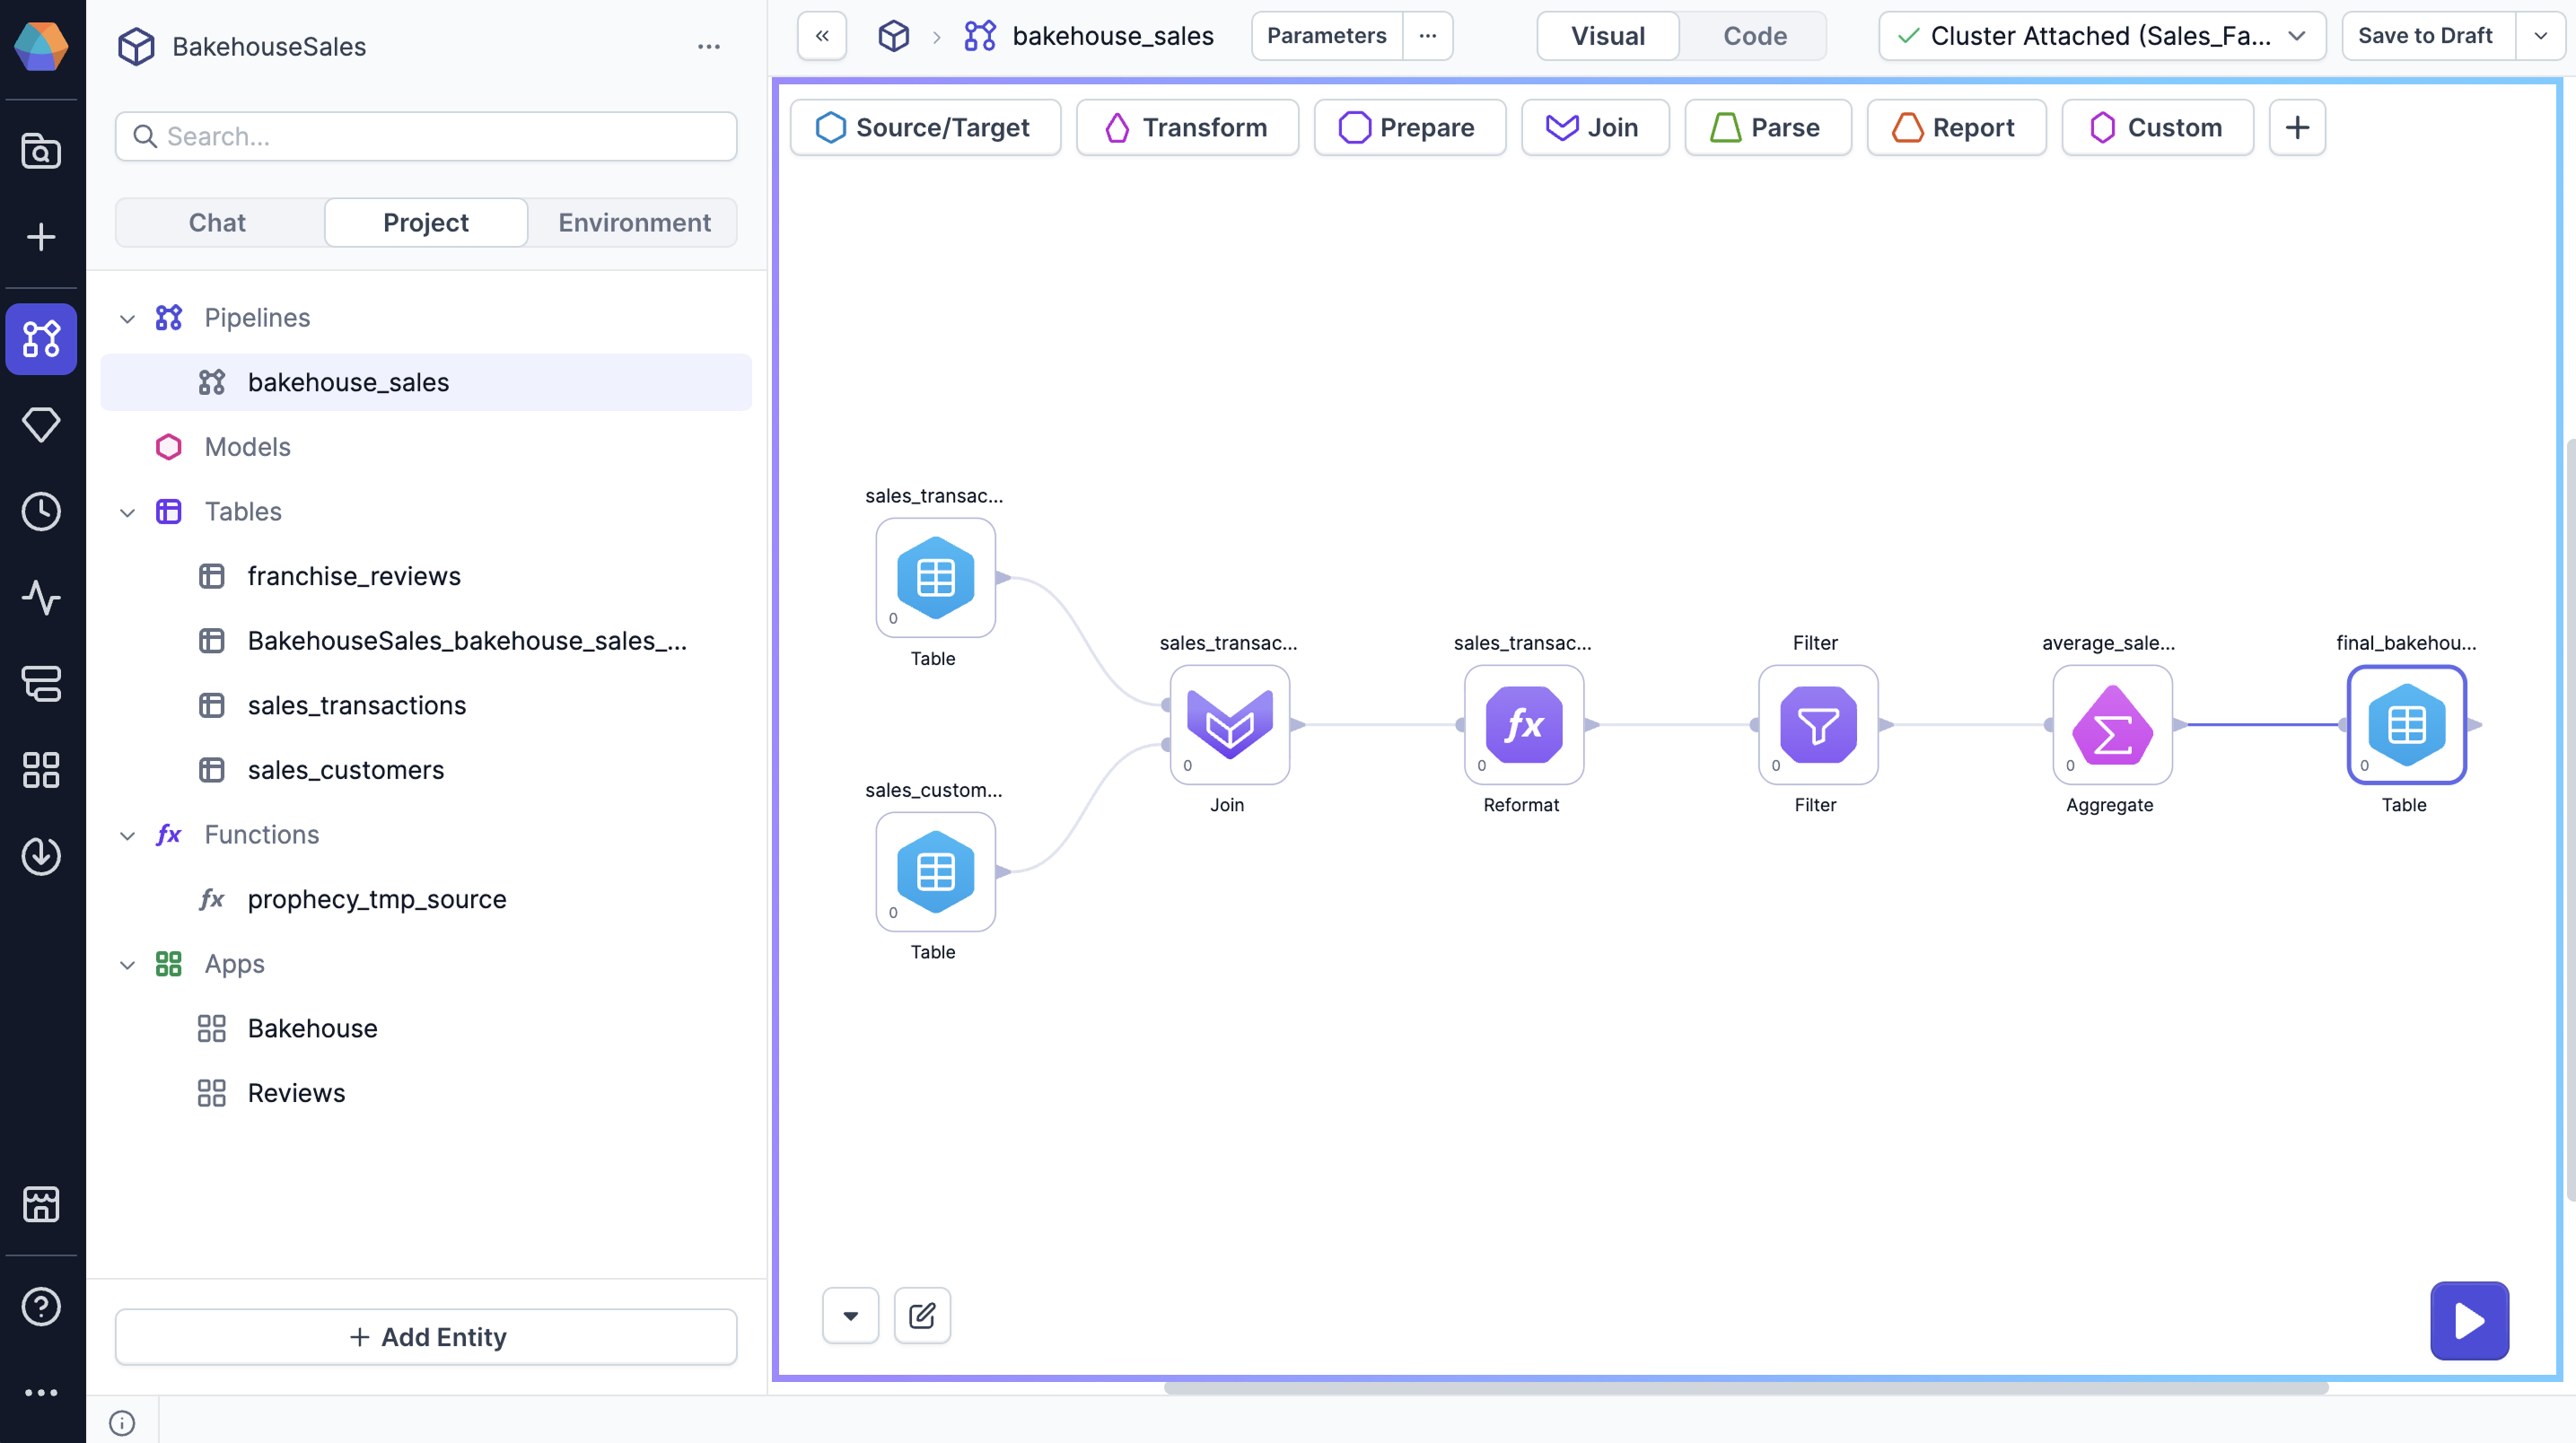
Visual canvas
The visual canvas is the workspace where you can add and connect various gems to build your pipeline. It provides a drag-and-drop interface for designing your data flow.
| Element | Description |
|---|---|
| Gem drawer | At the top of the visual canvas, the gem drawer displays gem categories such as Transform and Join, which contain all the gems available for use in your pipeline. |
| Run button | The run button triggers pipeline execution. This allows you to test and run the pipeline in real-time, which makes it easier to troubleshoot and verify the pipeline's performance before deployment. To learn more, visit Pipeline execution. |
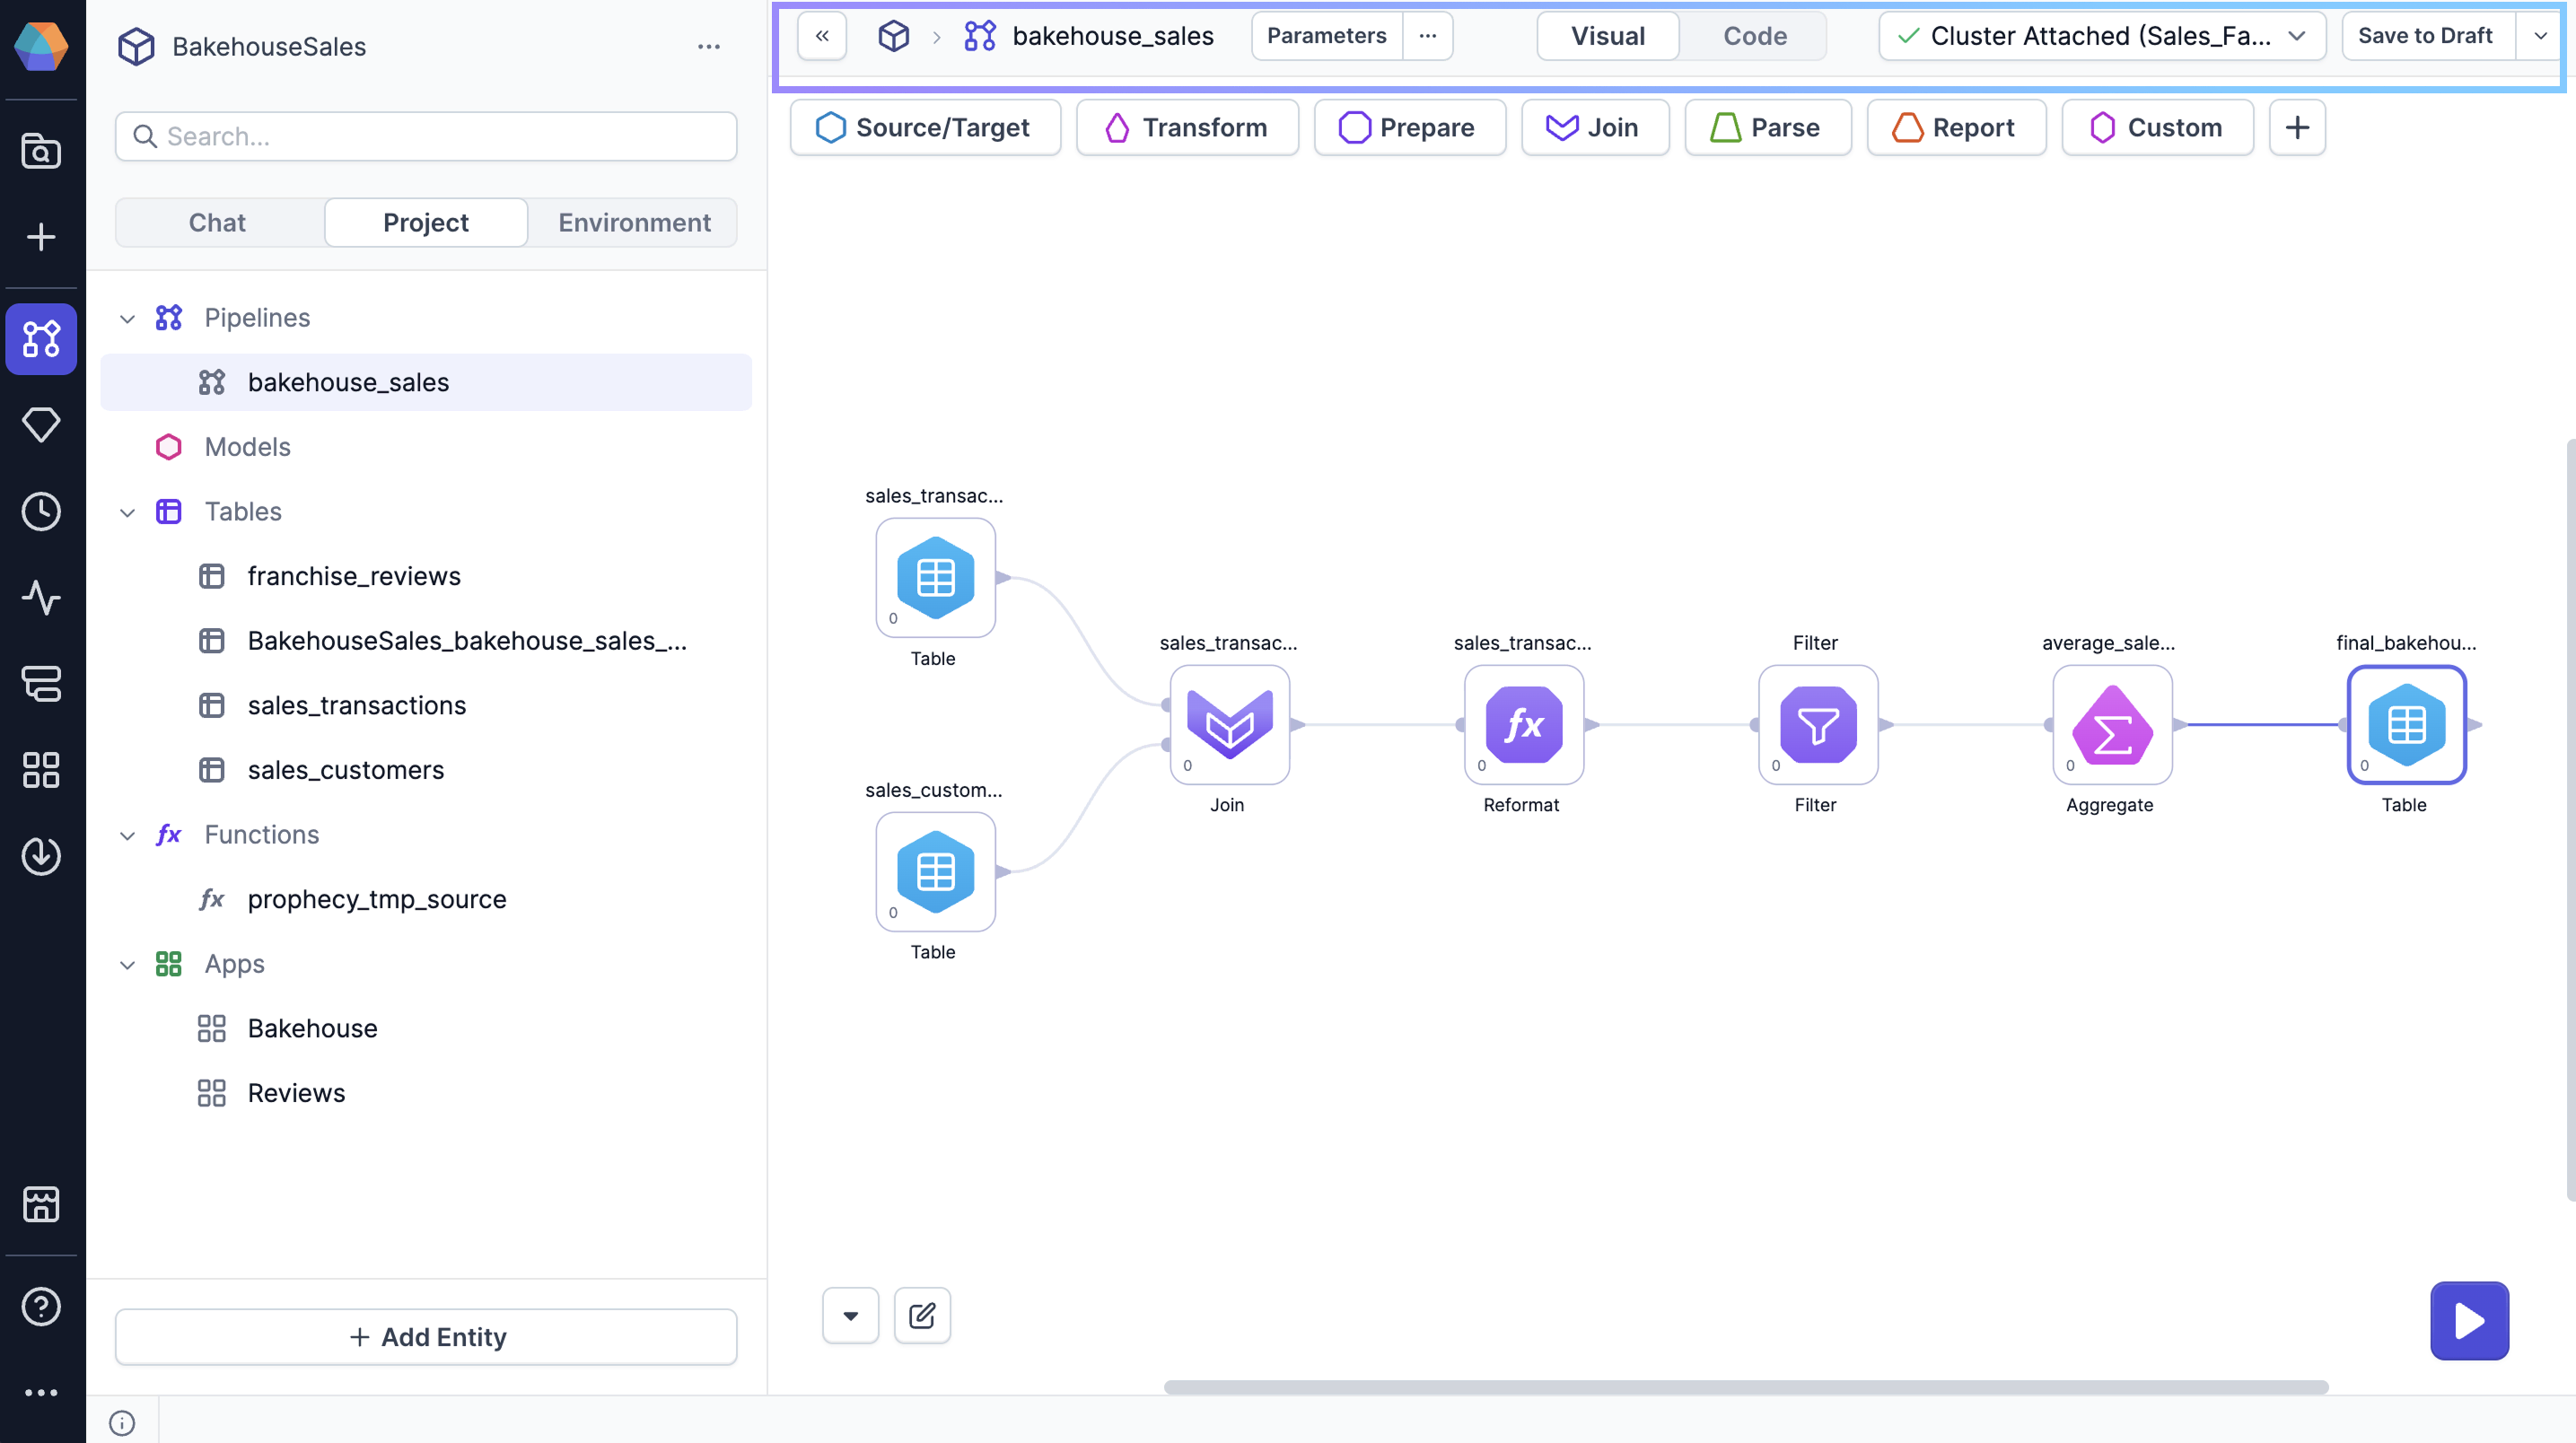
Header
The project header includes the following features.
| Control | Description |
|---|---|
| Parameters | Click on Parameters to open settings that dynamically define how your pipeline behaves at runtime. For more information, visit Pipeline parameters. |
| ... Ellipses menu | Access various settings and metadata for your pipeline. Options include:
|
| Visual-Code toggle | Switch from the visual canvas to the code view to see your visual pipeline compiled into code. This view helps users who prefer working with code to understand the underlying logic. |
| Fabric dropdown | Use the fabric dropdown to select the fabric to attach to. This is the fabric that will be used for interactive execution. In most cases, you will connect to a development environment while you build your pipeline. |
| Version menu | If you create your project using the simple Git storage model, you will see the version menu in the project header. Use this menu to save your project, publish your project, or view your project history. |
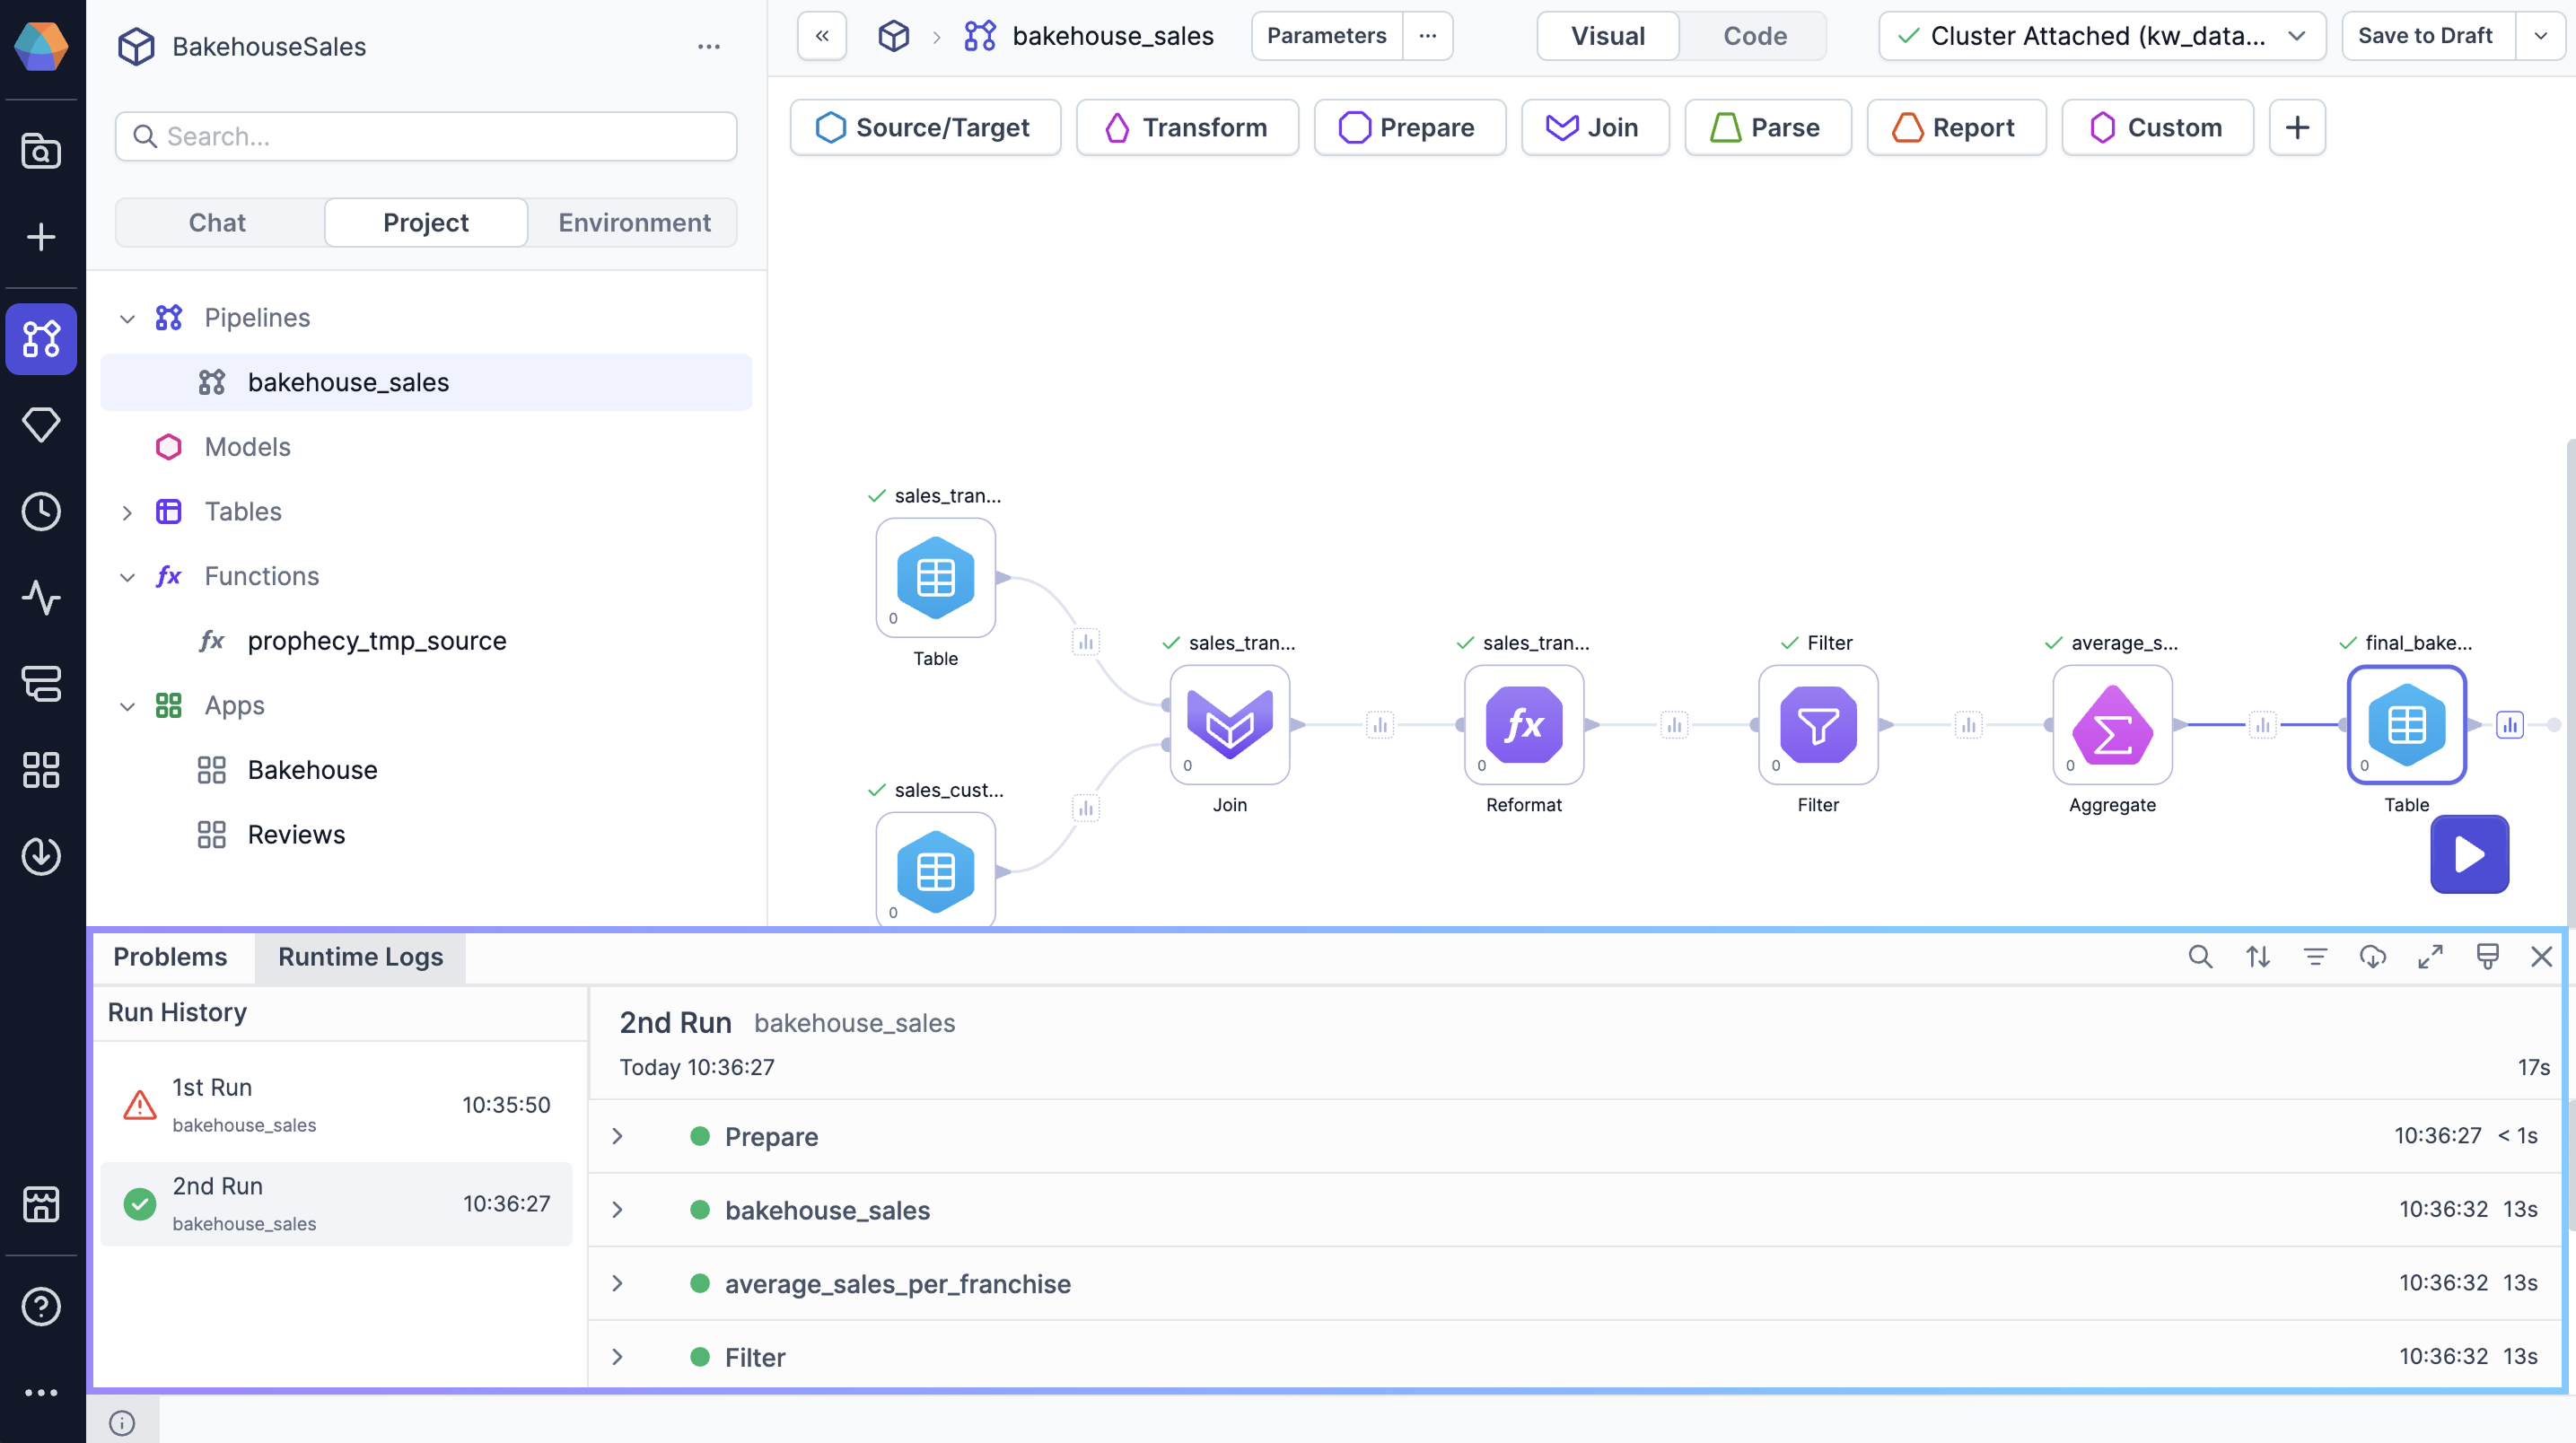
Footer
The project footer includes the following elements.
| Element | Description |
|---|---|
| Problems | The Problems panel highlights any issues or errors in your pipeline that need attention. It provides detailed feedback on what needs to be fixed to ensure that your pipeline runs successfully. |
| Runtime Logs | Runtime logs offer detailed insights into the status and progress of your pipeline executions. They provide a step-by-step trace of how each transformation or action was performed, any errors, and other progress messages. |
| Git workflow | If you create your project using the normal Git storage model, you will see the Git workflow in the project footer. Open the Git workflow to perform actions like committing, merging, or deploying the project. |