Bar chart
A bar chart groups data by categories, using rectangular bars with heights or lengths proportional to the values they represent.
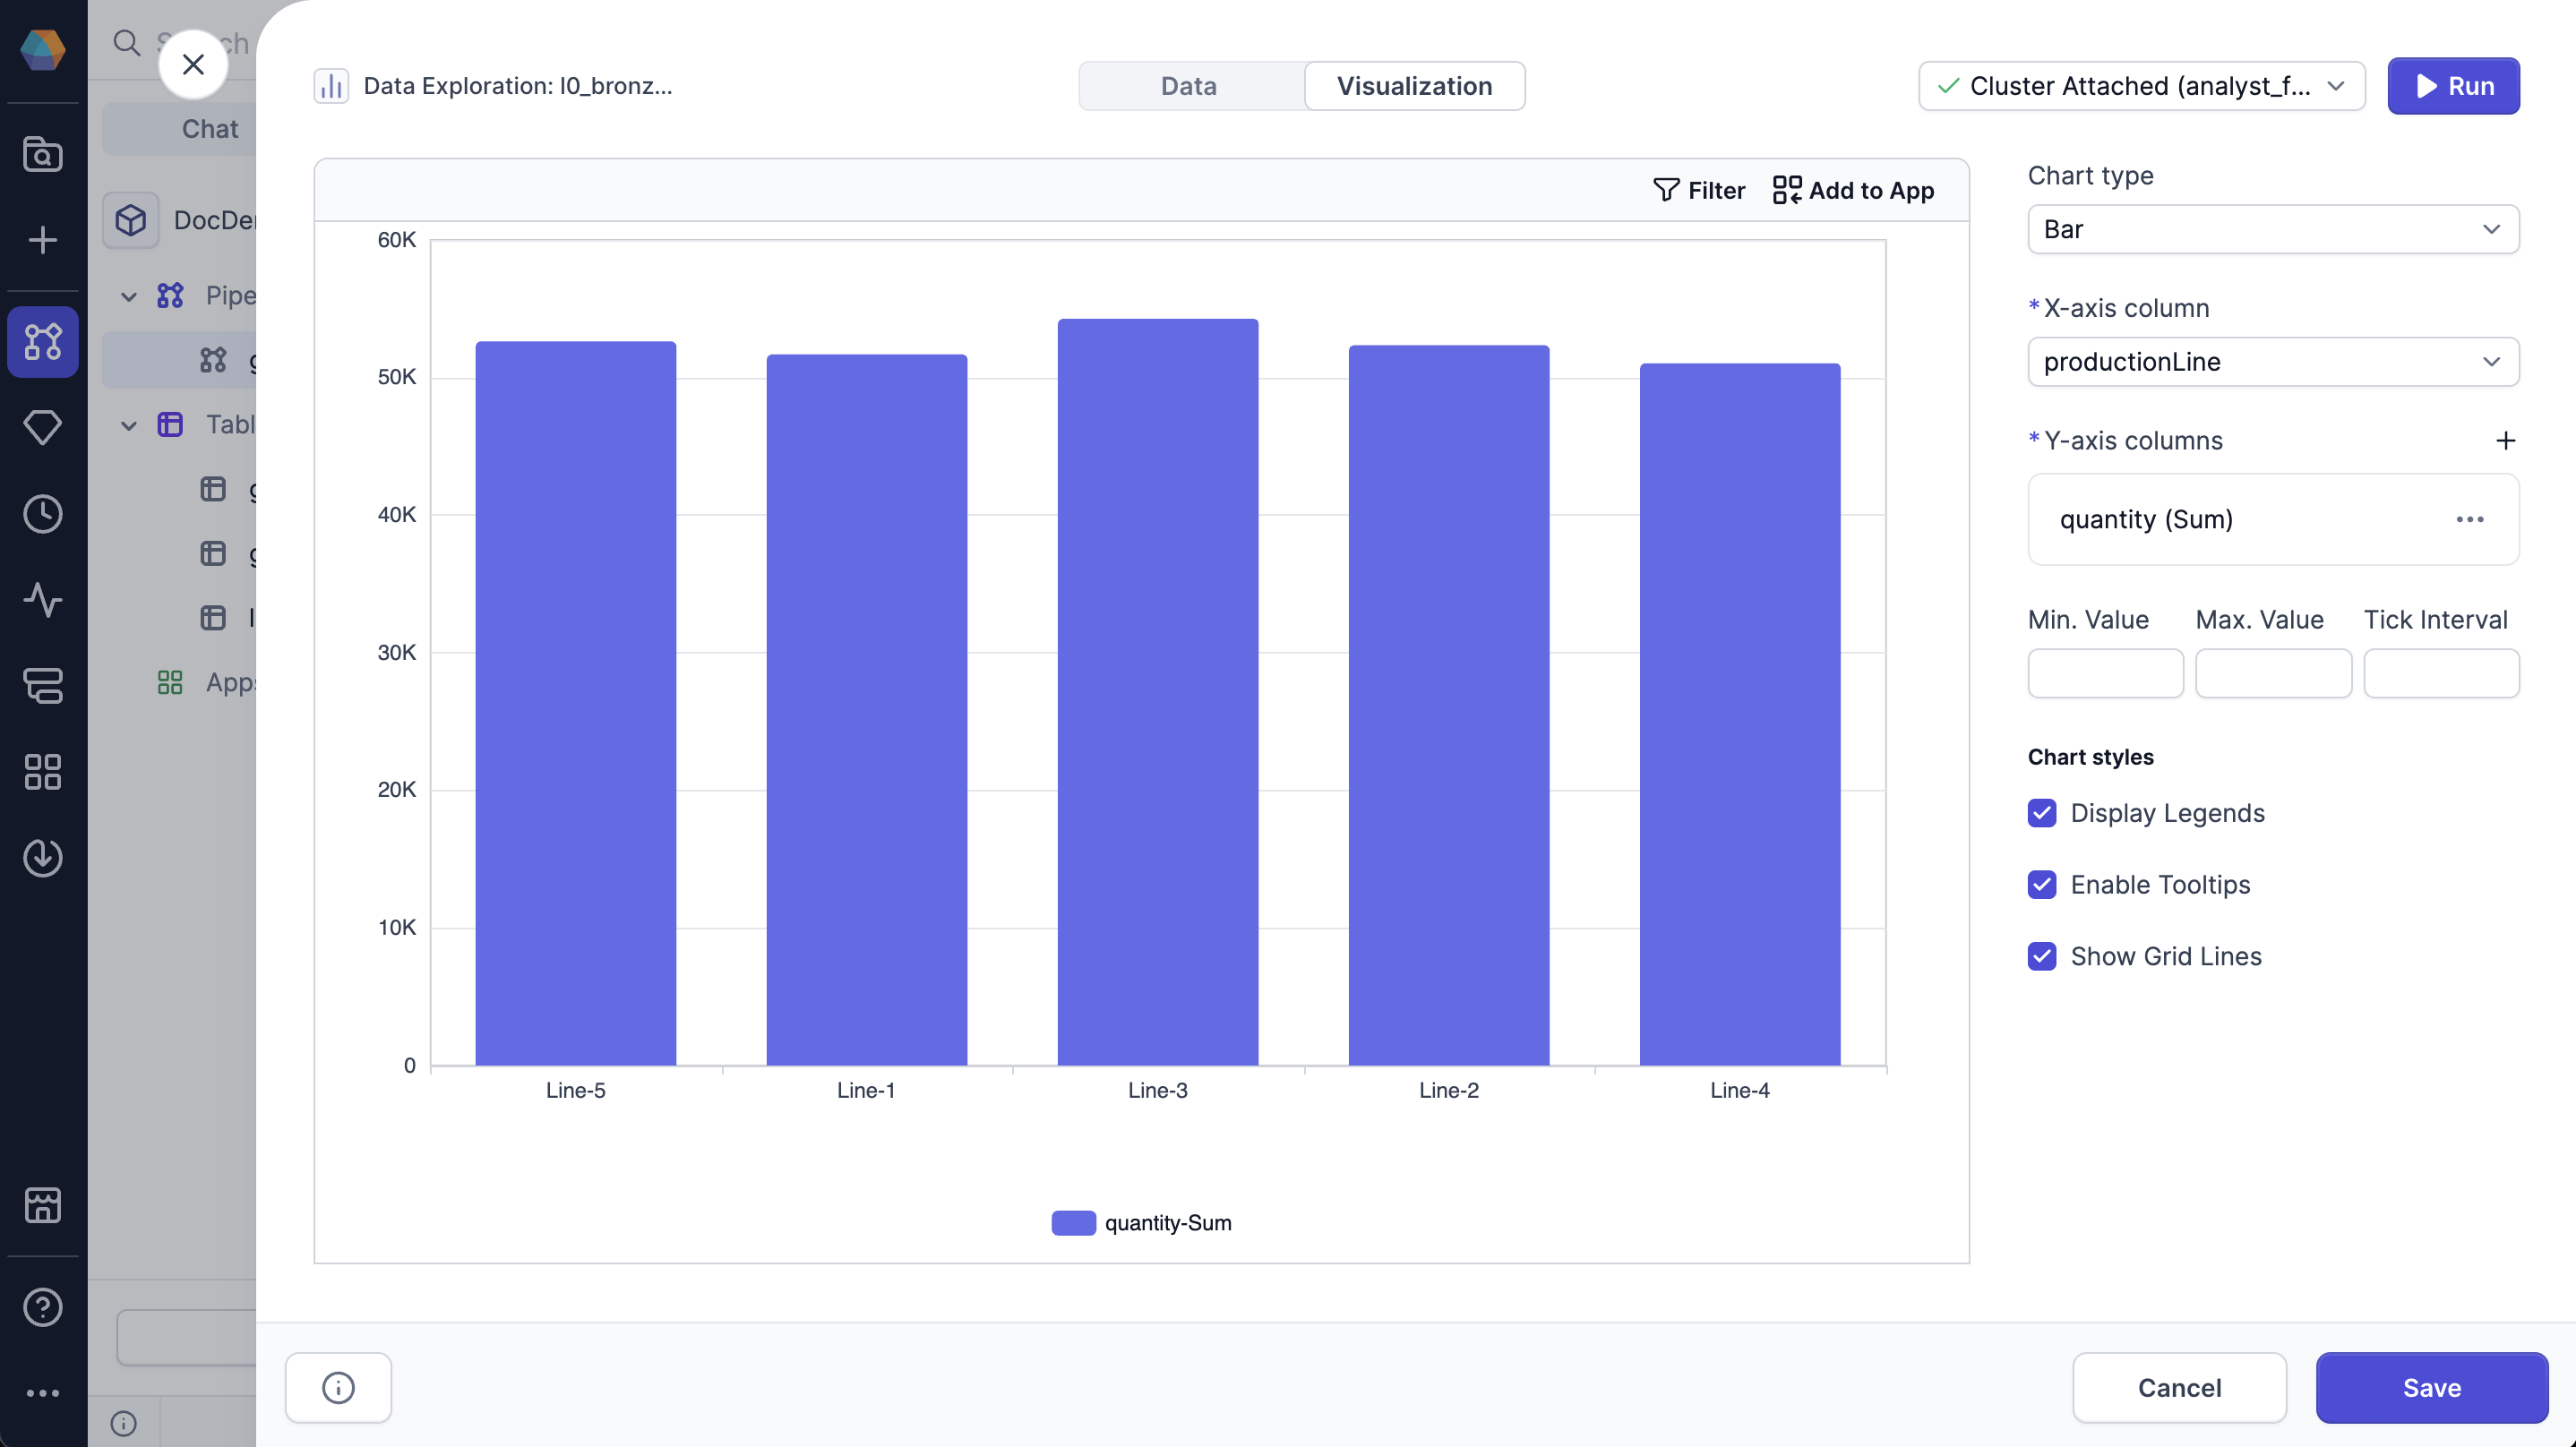
You can configure the following parameters for the chart:
| Parameter | Description |
|---|---|
| X-axis column | Column used for the X-axis categories. |
| Y-axis column | Column used for the Y-axis values. |
| Min. Value | Minimum value displayed on the Y-axis. |
| Max. Value | Maximum value displayed on the Y-axis. |
| Tick Interval | Interval between tick marks on the Y-axis. |
| Display Legends | Whether to display the legend on the chart. |
| Enable Tooltips | Whether to display tooltips on hover. |
| Show Grid Lines | Whether to display grid lines on the chart. |